The R ggplot2 Jitter is very useful to handle the overplotting caused by the smaller datasets discreteness. Let us see how to plot a ggplot jitter, Format its color, change the labels, adding boxplot, violin plot, and alter the legend position using the ggplot2 package with example.
The syntax to draw a ggplot jitter in R Programming is
geom_jitter(data = NULL, width = NULL, height = NULL)
and the complex syntax behind this Jitter is:
geom_jitter(mapping = NULL, data = NULL, stat = "identity",
            width = NULL, height = NULL, position = "jitter", ...,
            na.rm = FALSE, show.legend = NA, inherit.aes = TRUE)
Create R ggplot2 Jitter
Let us see how to plot the Jitter using the ggplot2 package, and we are going to use the ChickWeight data set, provided by the Studio.
TIP: The ggplot2 package not installed by default. Please refer Install R Packages article to install the package in R Programming.
# Importing the ggplot2 library
library(ggplot2)

# Creating basic Jitter
ggplot(ChickWeight, aes(x = Diet, y = weight)) +
  geom_jitter()
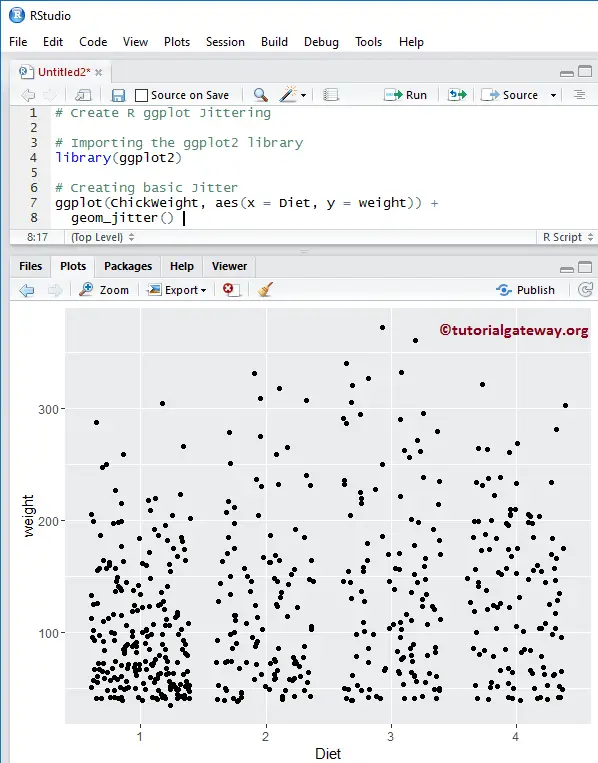
NOTE: If you require to import data from external files, then please refer R Read CSV article to import the CSV file.
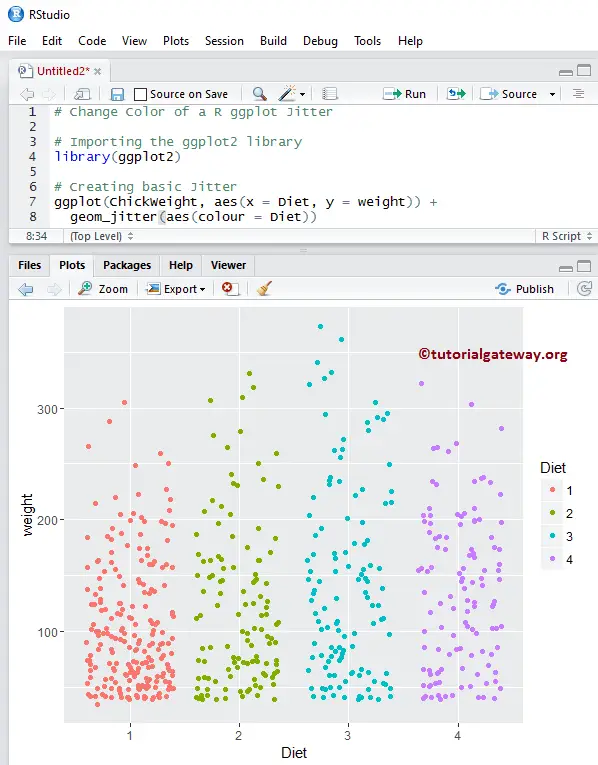
Change Colors of a Jiiter in R
Let us see how to change the Jitter plot dot colors using the color argument
# Change Color of a Jitter

# Importing the ggplot2 library
library(ggplot2)

# Creating basic Jitter
ggplot(ChickWeight, aes(x = Diet, y = weight)) +
  geom_jitter(aes(colour = Diet))
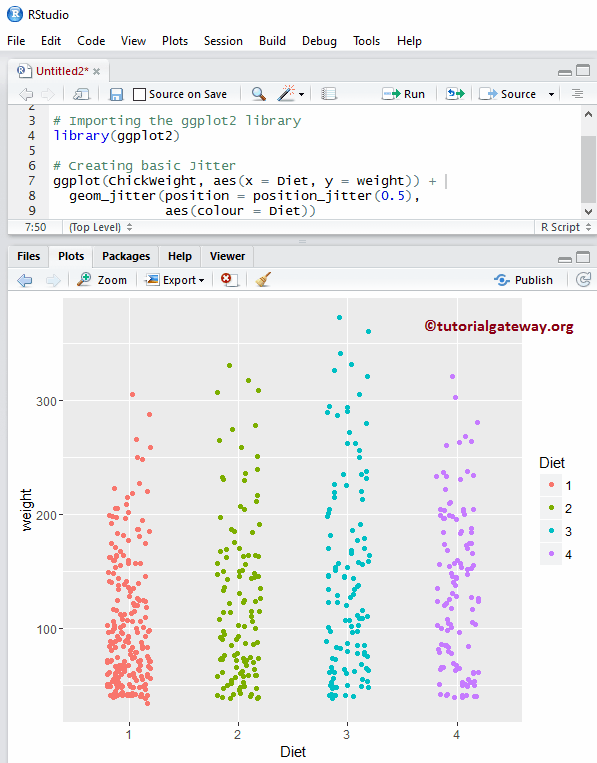
Position adjustment in a ggplot2 Jitter
Here, we show how to adjust the dot positions using position argument
# Position adjustment of a Jitter

# Importing the ggplot2 library
library(ggplot2)

# Creating basic Jitter
ggplot(ChickWeight, aes(x = Diet, y = weight)) +
  geom_jitter(position = position_jitter(0.5),
              aes(colour = Diet))
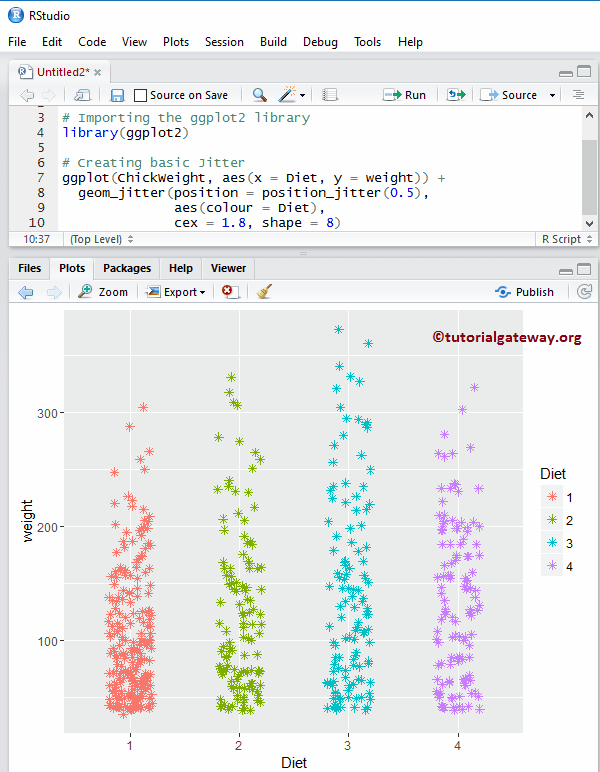
Change Size, and Shape of a dot in a R ggplot2 Jitter
How to change the size of the character that represents the point using cex argument, and shape of the character using shape argument.
- cex: Please specify the size of the point(s)
# Change Shape & Size of a Point in a ggplot Jitter

# Importing the ggplot2 library
library(ggplot2)

# Creating basic Jitter
ggplot(ChickWeight, aes(x = Diet, y = weight)) +
  geom_jitter(position = position_jitter(0.5),
              aes(colour = Diet),
              cex = 1.8, shape = 8)
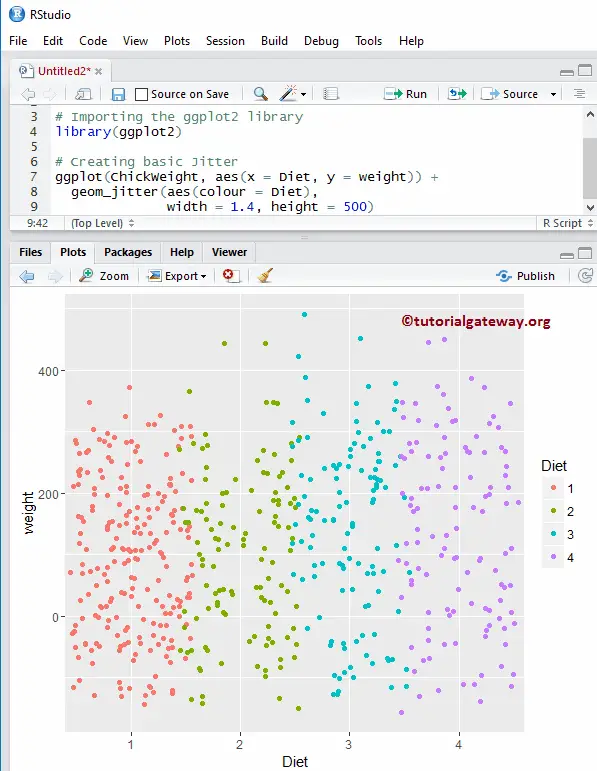
Change Width, and Height of a ggplot2 Jitter
In this example, we show how to change the width and height of the jitter plot
# Change Width & Height of a Jitter

# Importing the ggplot2 library
library(ggplot2)

# Creating basic Jitter
ggplot(ChickWeight, aes(x = Diet, y = weight)) +
  geom_jitter(aes(colour = Diet),
              width = 1.4, height = 500)
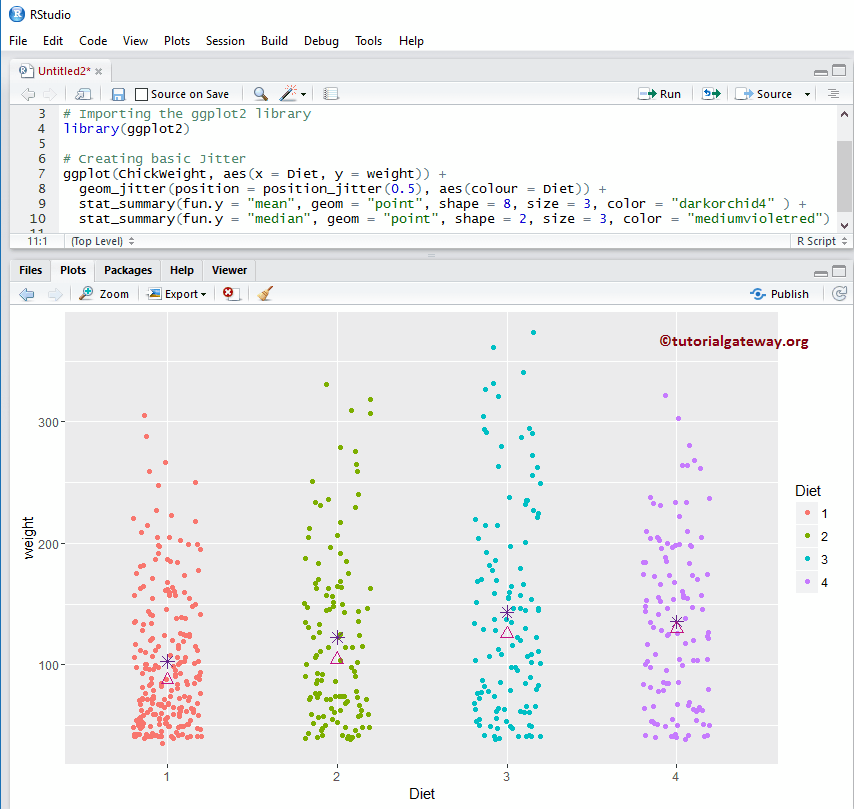
Add Mean & Median to R ggplot2 Jitter
Let us see how to add Mean, and Median value toggplot2 Jitter plot using stat_summary function.
# Add Mean & Median to R ggplot Jitter

# Importing the ggplot2 library
library(ggplot2)

# Creating basic Jitter
ggplot(ChickWeight, aes(x = Diet, y = weight)) +
  geom_jitter(position = position_jitter(0.5), aes(colour = Diet)) +
  stat_summary(fun.y = "mean", geom = "point",
               shape = 8, size = 3, color = "darkorchid4" ) +
  stat_summary(fun.y = "median", geom = "point",
               shape = 2, size = 3, color = "mediumvioletred")
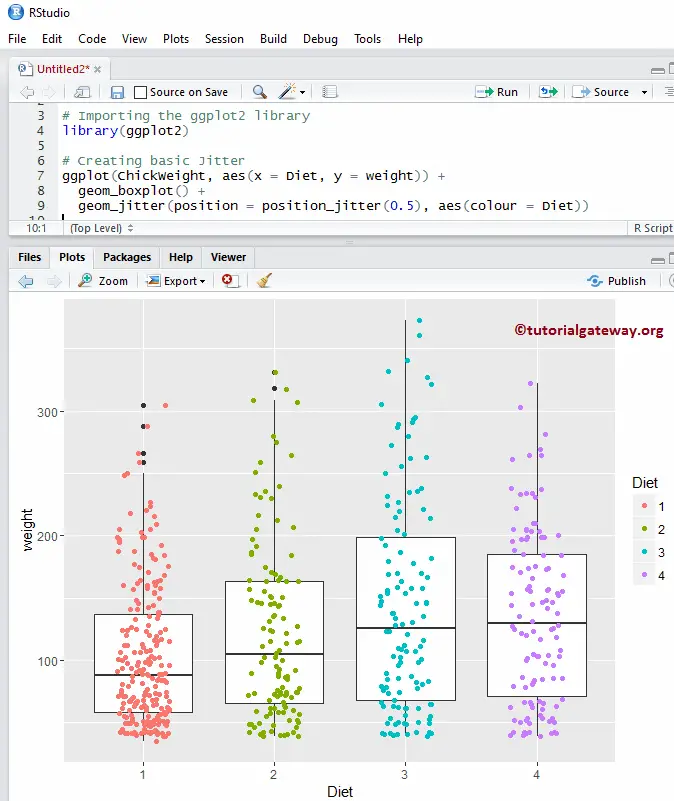
Add Boxplot to ggplot2 Jitter
In this example, we add boxplot to R Jitter using geom_boxplot function. It help us to see the Median, along with the quartile for our violin plot.
TIP: Please refer R ggplot2 Boxplot article to understand the Boxplot arguments.
# Add Boxplot to Jitter

# Importing the ggplot2 library
library(ggplot2)

# Creating basic Jitter
ggplot(ChickWeight, aes(x = Diet, y = weight)) +
  geom_boxplot() +
  geom_jitter(position = position_jitter(0.5), aes(colour = Diet))
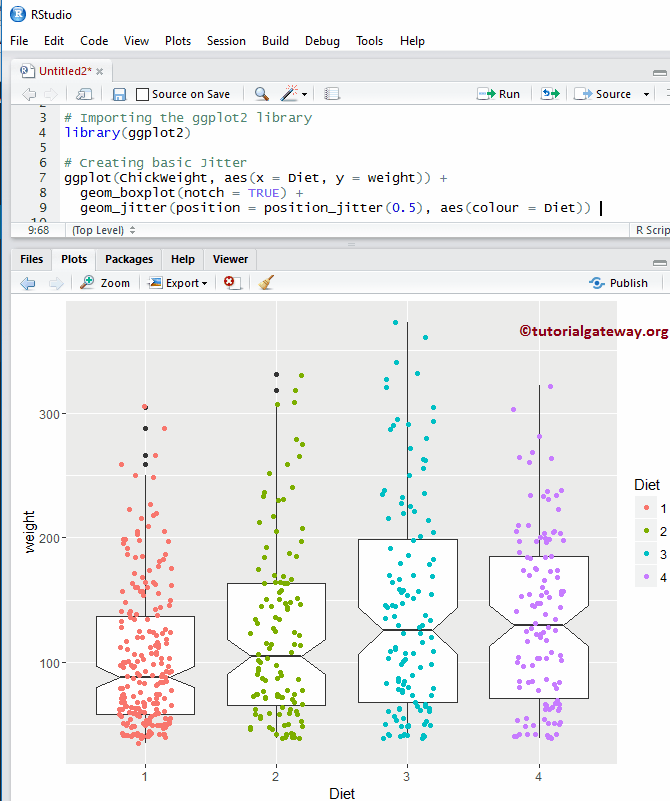
Add Boxplot to ggplot2 jitter 2
In this example, we draw a line on each side of the boxes using the notch argument
# Add Boxplot to Jitter

# Importing the ggplot2 library
library(ggplot2)

# Creating basic Jitter
ggplot(ChickWeight, aes(x = Diet, y = weight)) +
  geom_boxplot(notch = TRUE) +
  geom_jitter(position = position_jitter(0.5), aes(colour = Diet))
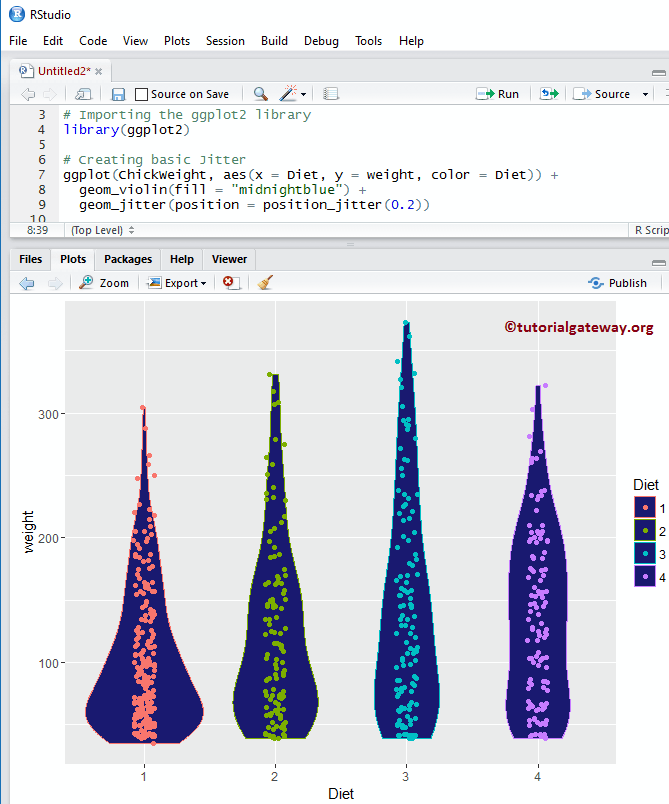
Add Violin plot to R ggplot2 Jitter
In this example, we show how to add a Violin Plot to Jitter using the geom_violin function.
TIP: Please refer to the R ggplot2 Violin Plot article to understand the Violin plot arguments.
# Add Violin Plot to Jitter

# Importing the ggplot2 library
library(ggplot2)

# Creating basic Jitter
ggplot(ChickWeight, aes(x = Diet, y = weight, color = Diet)) +
  geom_violin(fill = "midnightblue") +
  geom_jitter(position = position_jitter(0.2))
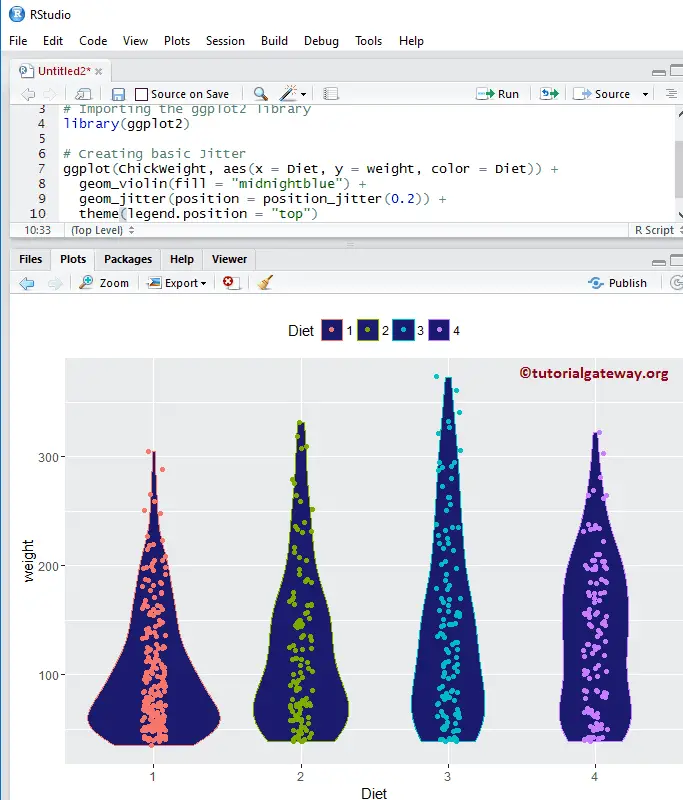
Alter Legend position of a ggplot2 Jitter
By default, ggplot position the legend at the right side of a Jitter. Let us see how to change the legend position from right to top. Note, You can use legend.position = “none” to completely remove the legend.
# Alter Legend Position in Jitter

# Importing the ggplot2 library
library(ggplot2)

# Creating basic Jitter
ggplot(ChickWeight, aes(x = Diet, y = weight, color = Diet)) +
  geom_violin(fill = "midnightblue") +
  geom_jitter(position = position_jitter(0.2)) +
  theme(legend.position = "top")
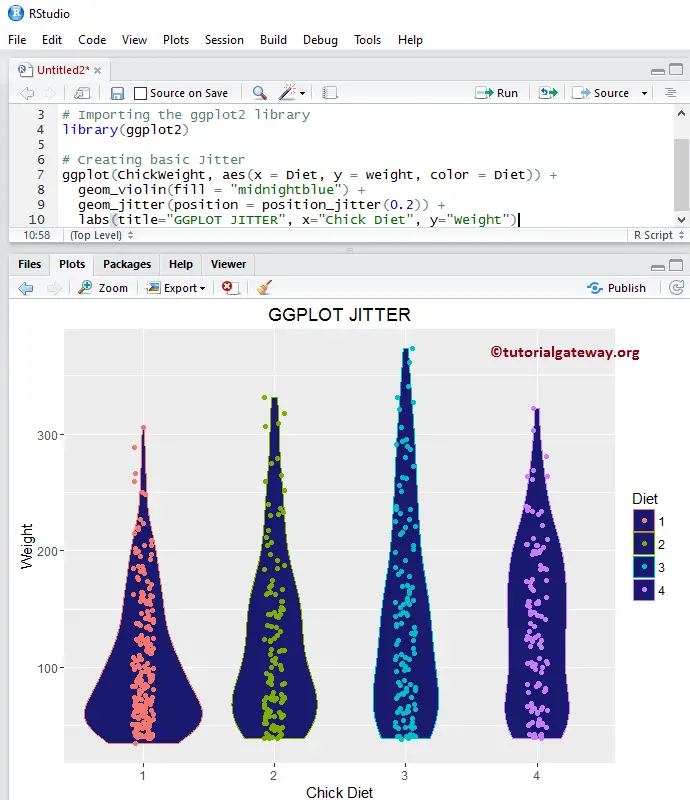
Assigning names to ggplot2 Jitter
How to assign names to ggplot jitter plot, X-Axis, and Y-Axis using labs function?
# Alter Legend Position

# Importing the ggplot2 library
library(ggplot2)

# Creating basic Jitter
ggplot(ChickWeight, aes(x = Diet, y = weight, color = Diet)) +
  geom_violin(fill = "midnightblue") +
  geom_jitter(position = position_jitter(0.2)) +
  theme(legend.position = "top")
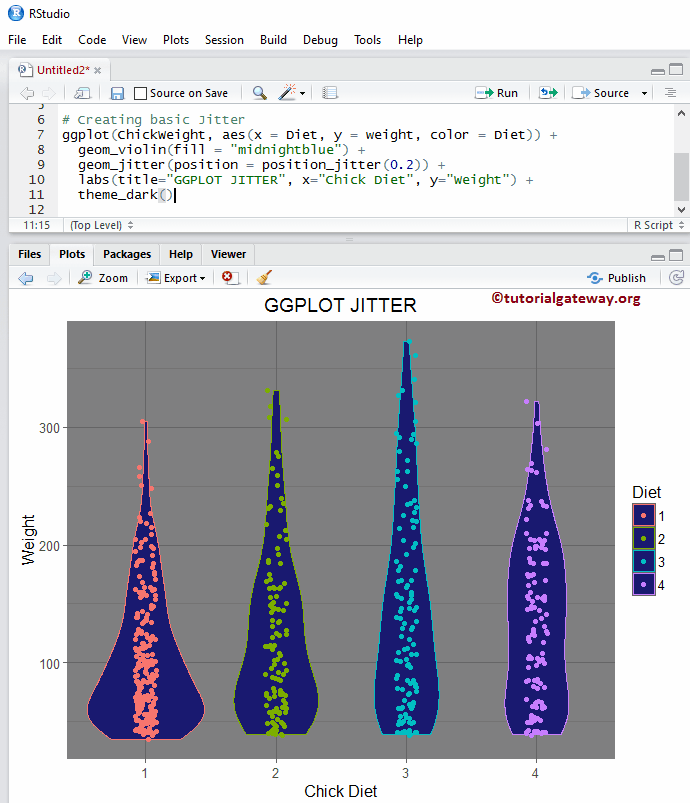
Change R ggplot2 Jitter Theme
In this example, we show how to change the default theme of a ggplot jitter
- theme_dark(): We use this function to change the jitter default theme to dark. If you type theme_ then R Studio intelligence will show you the list of available options. For example, theme_grey()
# Change the Theme of a Jitter

# Importing the ggplot2 library
library(ggplot2)

# Creating basic Jitter
ggplot(ChickWeight, aes(x = Diet, y = weight, color = Diet)) +
  geom_violin(fill = "midnightblue") +
  geom_jitter(position = position_jitter(0.2)) +
  labs(title="GGPLOT JITTER", x="Chick Diet", y="Weight") +
  theme_dark()