Tutorial Gateway

  • C
  • C#
  • Java
  • Python
  • SQL
  • MySQL
  • Js
  • BI Tools
    • Informatica
    • Talend
    • Tableau
    • Power BI
    • SSIS
    • SSRS
    • SSAS
    • MDX
    • R Tutorial
    • Alteryx
    • QlikView
  • More
    • C Programs
    • C++ Programs
    • Python Programs
    • Java Programs

Create Pie Chart in SSRS Report Builder Wizard

by suresh

In this article, we will show you how to create Pie Chart in SSRS Report Builder Wizard. Or we can say, steps involved in creating Pie Chart using SSRS Report Builder.

To create a Pie Chart or any Report, we have to open the report builder. To do this, Please open your report manager and click on the Report Builder button as shown in below screenshot

Create Pie Chart in SSRS Report Builder Wizard 1

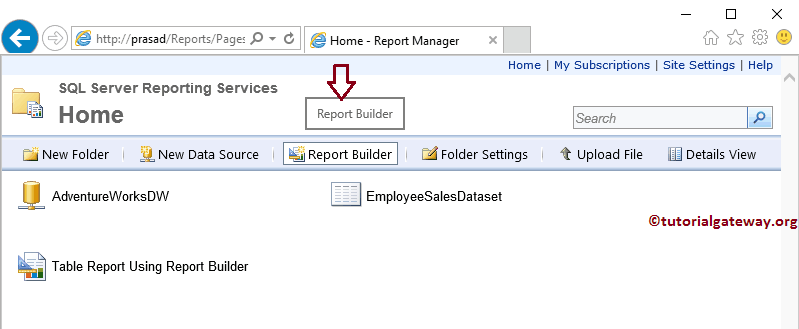
Once you click on the SSRS Report Builder button, SQL Server Report Builder will open with a starting page.

Create Pie Chart in SSRS Report Builder Wizard 2

Create Pie Chart in SSRS Report Builder Wizard

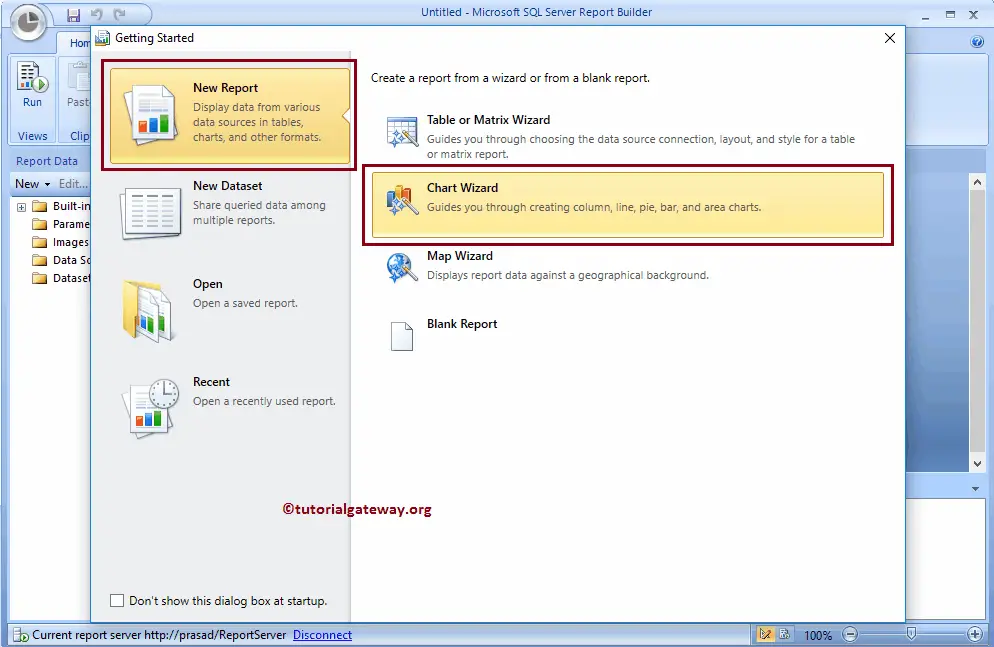
In this example, we want to create a Pie Chart in the SSRS Report Builder wizard. So, please select the New Report tab and then select the Chart Wizard option. It will be the same for Bar Chart, Column Chart.

Create Pie Chart in SSRS Report Builder Wizard 3

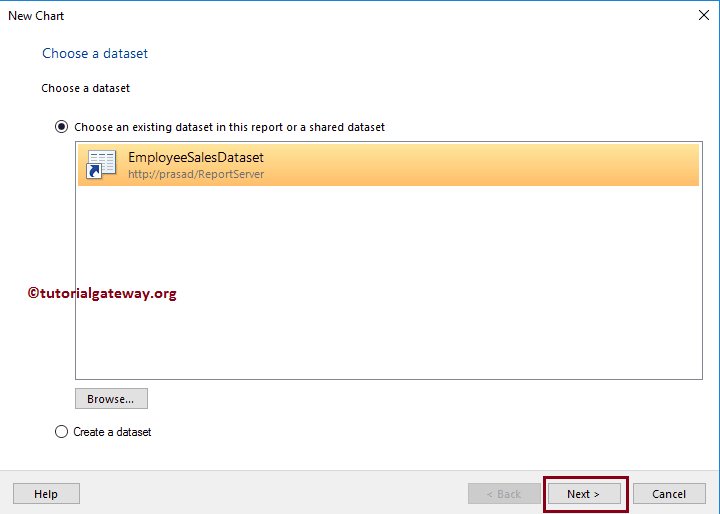
After you select the Chart Wizard option, a new window called New Chart will open. If you had any existing data sets or Shared dataset in your Report Server, then use the first option; otherwise, use the second option.

For now, we are selecting the first option. I suggest you refer the Create a New dataset in Report Builder article to understand the steps involved in creating a shared dataset.

Create Pie Chart in SSRS Report Builder Wizard 4

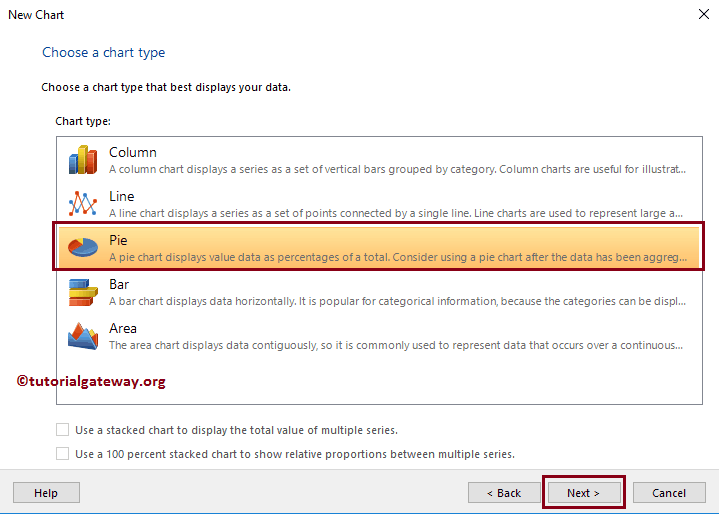
Next, Please select the Chart you want to create. Here we are selecting the Pie chart.

Create Pie Chart in SSRS Report Builder Wizard 5

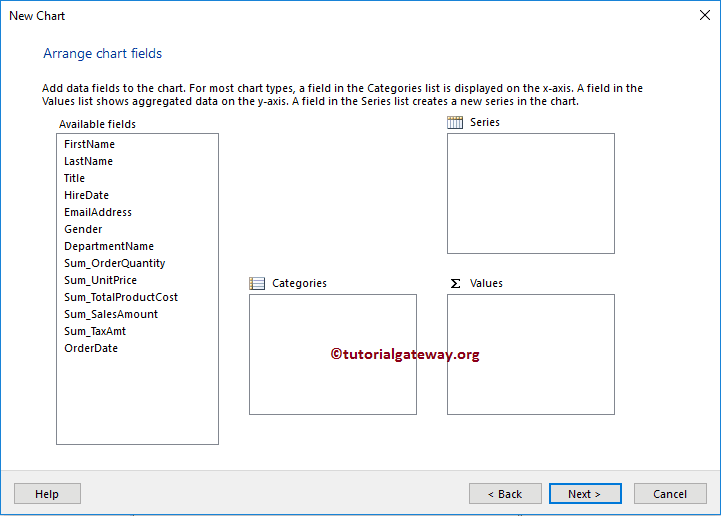
Next, we have three sections:

  • Available Fields: List of all the available columns in our dataset.
  • Categories: How you want to categorize the Pie Chart. For example, Country, region, Color, Product Group
  • Values: All the Metric column names that you want to display in the Pie Chart. It decides the Pie Slice size.
Create Pie Chart in SSRS Report Builder Wizard 6

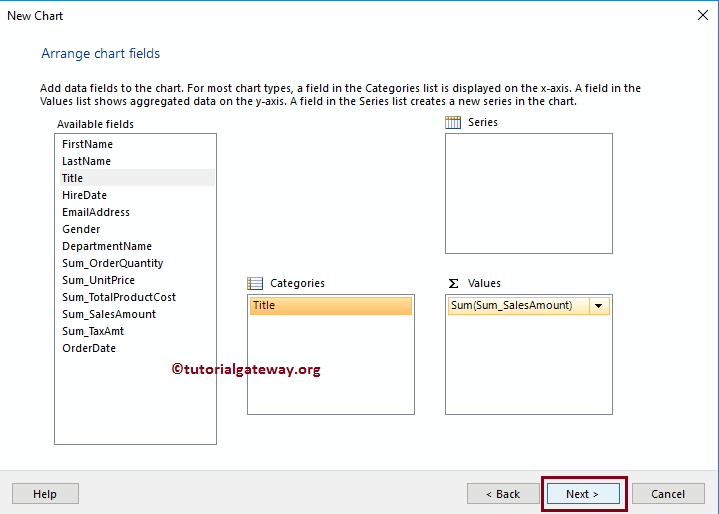
We are adding the Title to categories, and Sales Amount Column to Values. It means our pie chart will show you the Sales Amount by Employee Title.

Create Pie Chart in SSRS Report Builder Wizard 7

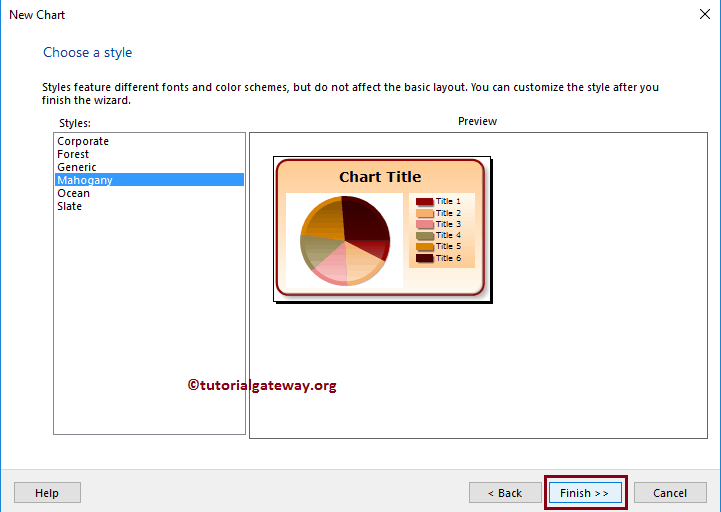
Please choose the layout from the existing templates.

Create Pie Chart in SSRS Report Builder Wizard 8

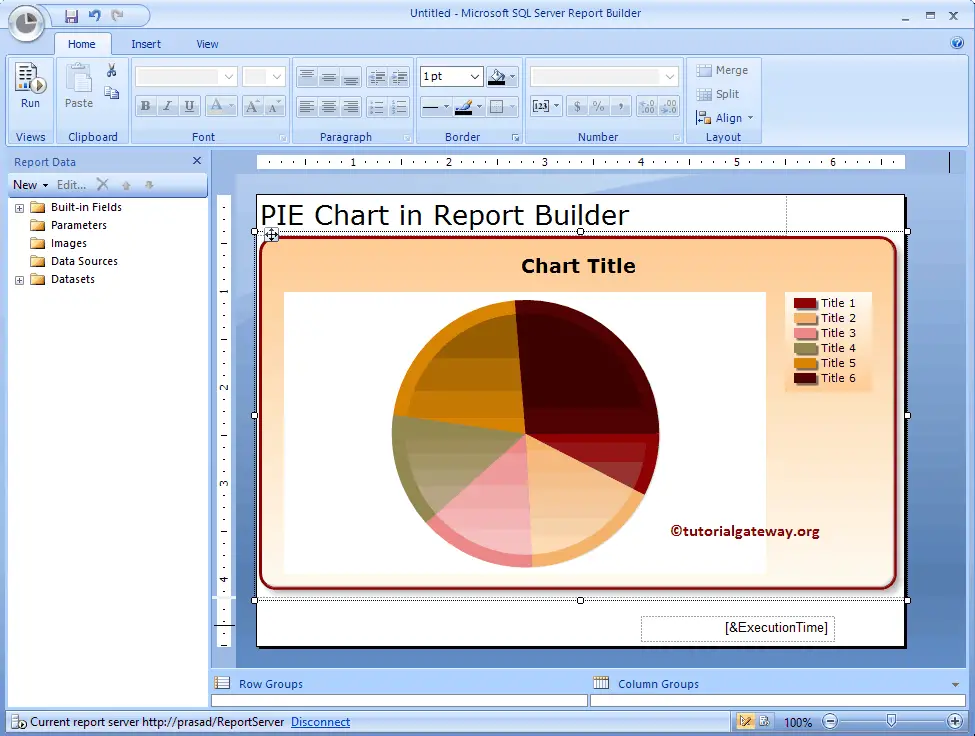
Now you can see the auto-generated report.

Create Pie Chart in SSRS Report Builder Wizard 9

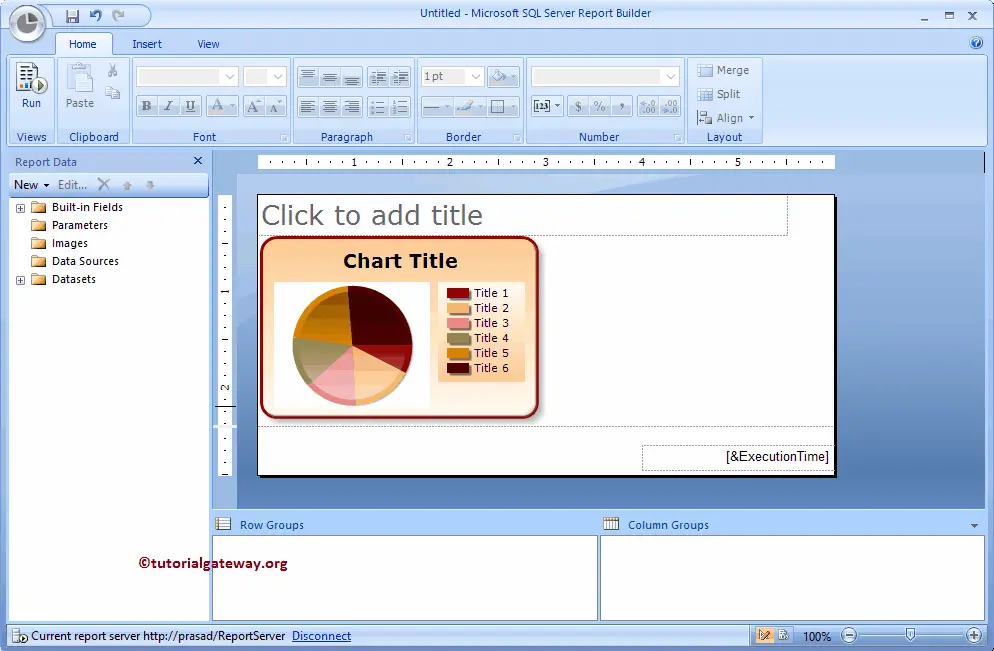
Let me add the Title to the PIE chart, and expand the PIE chart so that it looks neat and clean.

Create Pie Chart in SSRS Report Builder Wizard 10

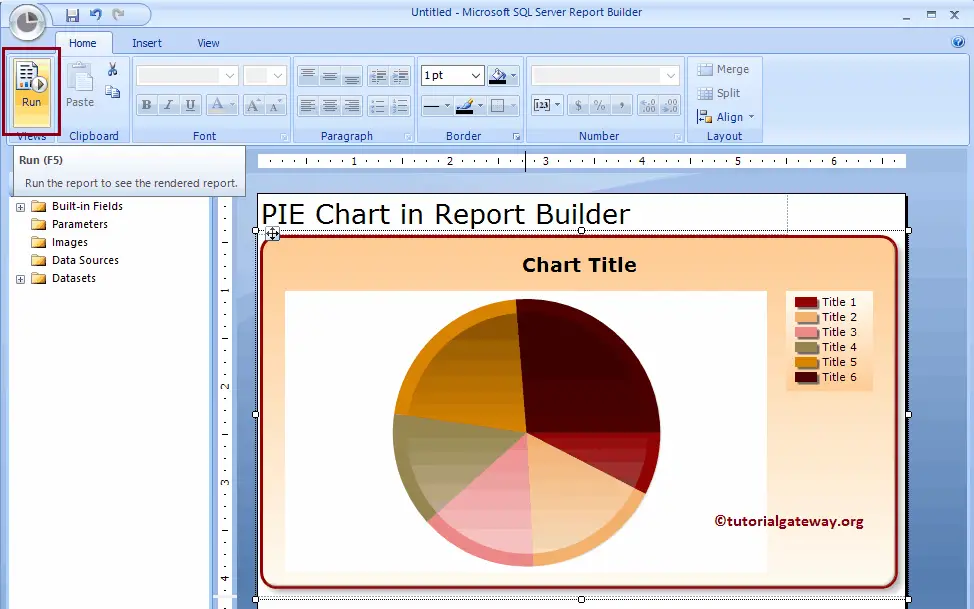
Remove the extra space around the report area, and click the Run button

Create Pie Chart in SSRS Report Builder Wizard 11

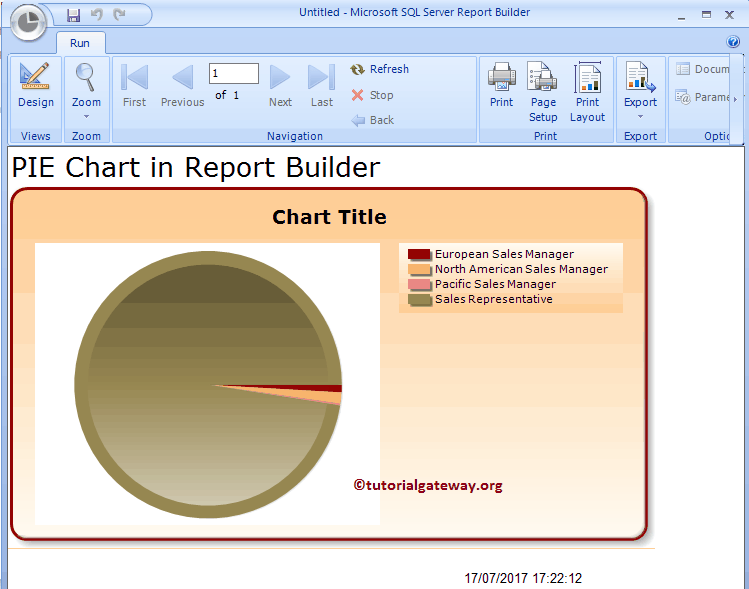
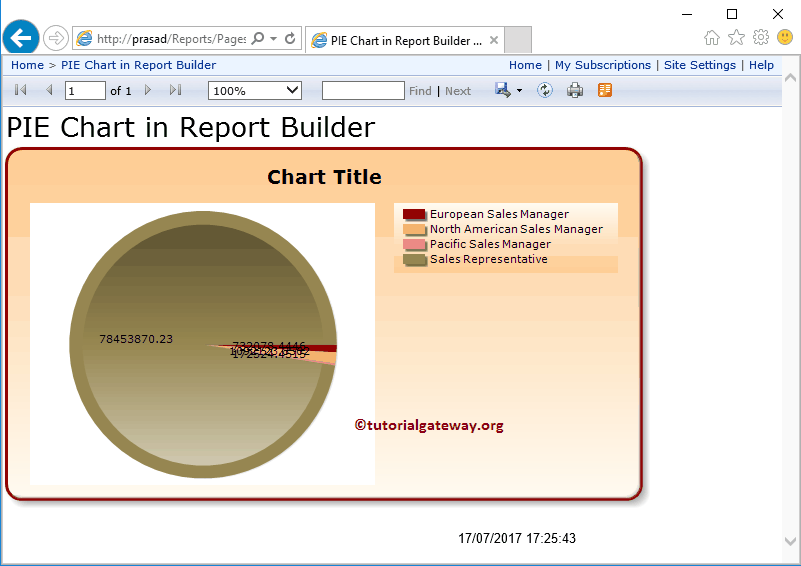
Once you click the Run button, the following report will generate.
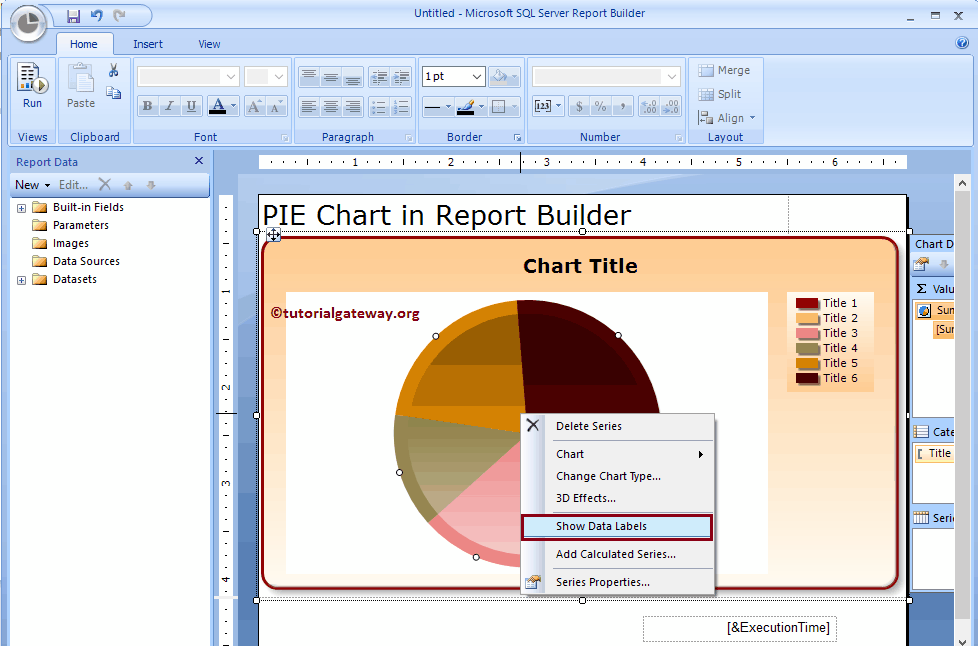
Create Pie Chart in SSRS Report Builder Wizard 12

Right click on the pie chart and select the Show Data Labels option from the context menu to show the values

Create Pie Chart in SSRS Report Builder Wizard 13

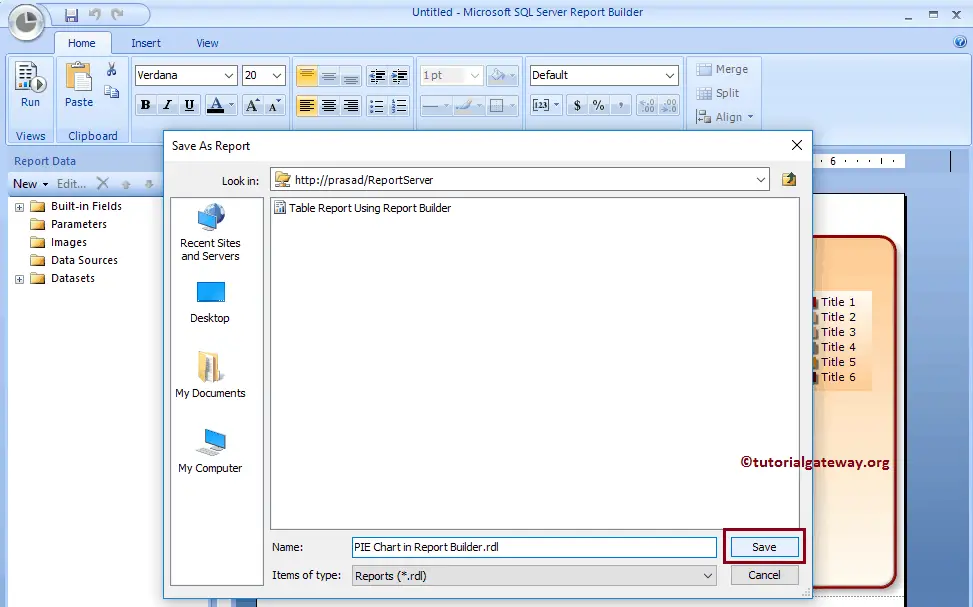
Let me deploy the report to the Report Manager by clicking the Save button

Create Pie Chart in SSRS Report Builder Wizard 14

After you click on the Save button, a new window called Save As Report will open. Here you have an option to select the local file system or the Report Server. Let me select the Report Server

Create Pie Chart in SSRS Report Builder Wizard 15

Let me open my Report Server to show the newly created Table Report. Here, If you want to see the report preview, or Run the report, then you don’t have to access the Report Builder or BIDS. Just click on the report will run the report. Let me select the report that we saved previously and click on it

Create Pie Chart in SSRS Report Builder Wizard 16

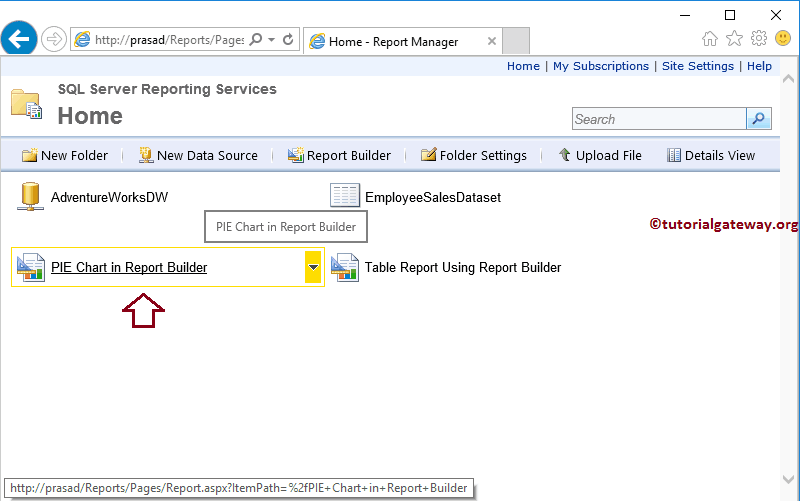
Now you can see the report inside the Report Server

Create Pie Chart in SSRS Report Builder Wizard 17

NOTE: Please refer to Formatting Pie Chart article to understand the steps involved in formatting labels, legends, and pallets.

Placed Under: SSRS

  • Learn SSRS in 28 Days
  • Create New SSRS Project
  • Create a New SSRS Report
  • SSRS Query Designer
  • SSRS Shared Data Source
  • SSRS Shared Dataset
  • SSRS Embedded Dataset
  • SSRS Embedded Data Source
  • SSRS Lookup – combine datasets
  • SSRS Report Items
  • SSRS Table Report
  • SSRS Table using report wizard
  • Format SSRS Table Report
  • SSRS Matrix Report
  • SSRS Matrix with report wizard
  • Display Image in SSRS Report
  • Add Rectangle to SSRS Report
  • Add TextBox to SSRS Report
  • Create a SSRS List Report
  • Grouping in SSRS Matrix Reports
  • Grouping in SSRS Table Reports
  • Create SSRS Report using Views
  • SSRS report with store procedure
  • Add Total and Subtotal to Report
  • Add Headers & Footers to Report
  • SSRS Global References
  • Export Report to PDF, XML, Excel, Word
  • Format SSRS Table Report
  • Format Textbox Fonts & Bg Color
  • Format Numbers in SSRS Report
  • Format SSRS Report Date, Time
  • Add Row Numbers to Report
  • Headers Visible While Scrolling
  • Repeat Headers on Each Page
  • SSRS Sorting
  • SSRS Interactive Sort
  • Filters at Dataset Level in SSRS
  • Filters at Tablix Level in SSRS
  • Page Breaks in SSRS Report
  • Custom Code in SSRS Report
  • SSRS Calculated Fields
  • SSRS Dashboard Reports
  • SSRS Document Map
  • SSRS Drill Through Reports
  • SSRS Drill Down Reports
  • SSRS Drill Down Matrix Report
  • SSRS Go To URL Action
  • SSRS Subreports
  • SSRS Report Parameters
  • SSRS Cascading Parameters
  • SSRS Multiple Parameters
  • SSRS Multi Value Parameter
  • SSRS Drop Down List Parameters
  • SSRS Charts
  • SSRS Area Chart
  • SSRS Bubble Chart
  • SSRS Column Chart
  • Format SSRS Column Chart
  • SSRS Data Bars
  • Data Bars in SSRS Matrix Reports
  • Format SSRS Data Bars
  • SSRS Funnel Chart
  • SSRS Linear Gauges
  • SSRS Radial Gauges
  • Format SSRS Gauges
  • SSRS Indicators
  • Format SSRS Indicators
  • SSRS Line Chart
  • SSRS Pie Chart
  • Format SSRS Pie Chart
  • SSRS Pyramid Chart
  • SSRS Range Chart
  • SSRS Radar Chart
  • SSRS Scatter Plot
  • SSRS Sparkline
  • SSRS Stacked Bar Chart
  • SSRS Configuration Manager
  • Change Report Manager Title
  • SSRS Deploying Reports in BIDS
  • Deploy using Report Manager
  • SSRS Report Manager Shared DataSource
  • SSRS Cached Reports
  • SSRS Linked Reports
  • SSRS Report Parts
  • SSRS Report Snapshot
  • SSRS Report History Snapshot
  • SSRS Report Subscription
  • SSRS Security
  • Upload File to Report Manager
  • Install SSRS Report builder
  • Report Builder – Create a Report
  • Report Builder – Create a Dataset
  • Report Builder- Create Bar chart
  • Report Builder – Create Pie Chart
  • Report Builder – Create report without wizard
  • C Tutorial
  • C# Tutorial
  • Java Tutorial
  • JavaScript Tutorial
  • Python Tutorial
  • MySQL Tutorial
  • SQL Server Tutorial
  • R Tutorial
  • Power BI Tutorial
  • Tableau Tutorial
  • SSIS Tutorial
  • SSRS Tutorial
  • Informatica Tutorial
  • Talend Tutorial
  • C Programs
  • C++ Programs
  • Java Programs
  • Python Programs
  • MDX Tutorial
  • SSAS Tutorial
  • QlikView Tutorial

Copyright © 2021 | Tutorial Gateway· All Rights Reserved by Suresh

Home | About Us | Contact Us | Privacy Policy