This SSRS article explains how to calculate the running Standard Deviation and the population Standard Deviation using RunningValue in a particular group or complete table with an example.
To demonstrate the SSRS Running Standard Deviation calculation, we use the Employee table below, which has 15 records grouped by Occupation. Next, we used the StDev function to display the Standard Deviation of Income and Sales columns per group and table. The image below shows the records in the Table report.
The StDev expressions that we used in the below report are:
Standard Deviation Per Group
=StDev(Fields!YearlyIncome.Value)
=StDev(Fields!Sales.Value)
Standard Deviation Per Table
=StDev(Fields!YearlyIncome.Value, "Tablix1")
=StDev(Fields!Sales.Value, "Tablix1")

Calculate the running standard deviation in SSRS
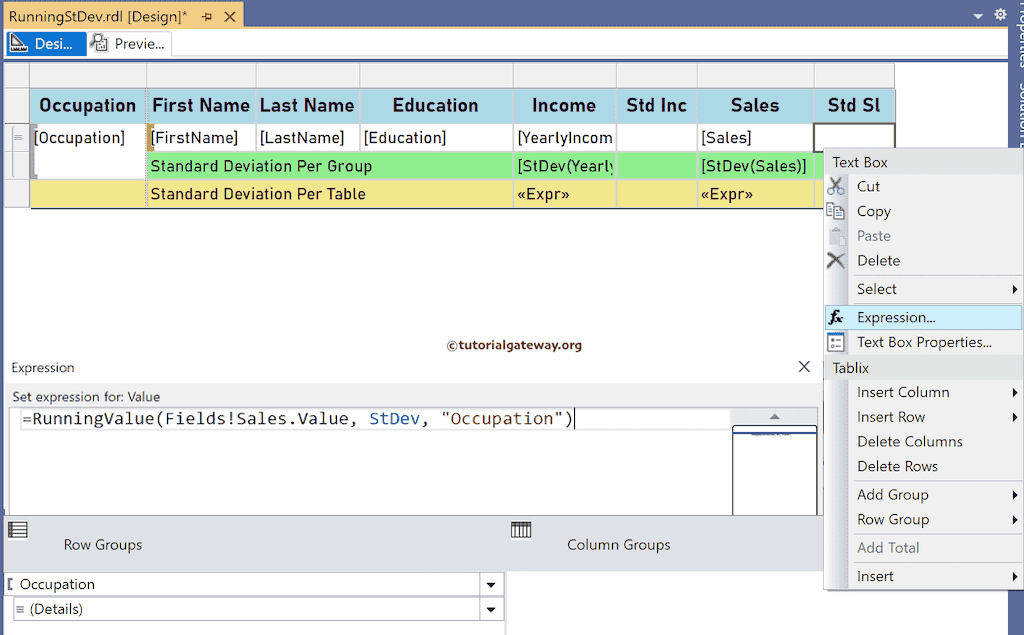
Let me add a new column to the right side of the Income and Sales and name the headers Std Inc and Std Sl. Next, right-click the textbox under the Std Sl and choose Expression. To understand the report, I suggest you refer to the StDev, Charts, Table, Grouping, and Format Table articles in SSRS.
It opens the following expression window to calculate the running Standard Deviation. We must use the aggregate StDev function inside the RunningValue function to get the same. The SSRS code below calculates each Occupation group’s running Standard Deviation of the Employee Sales.
=RunningValue(Fields!Sales.Value, StDev, "Occupation")
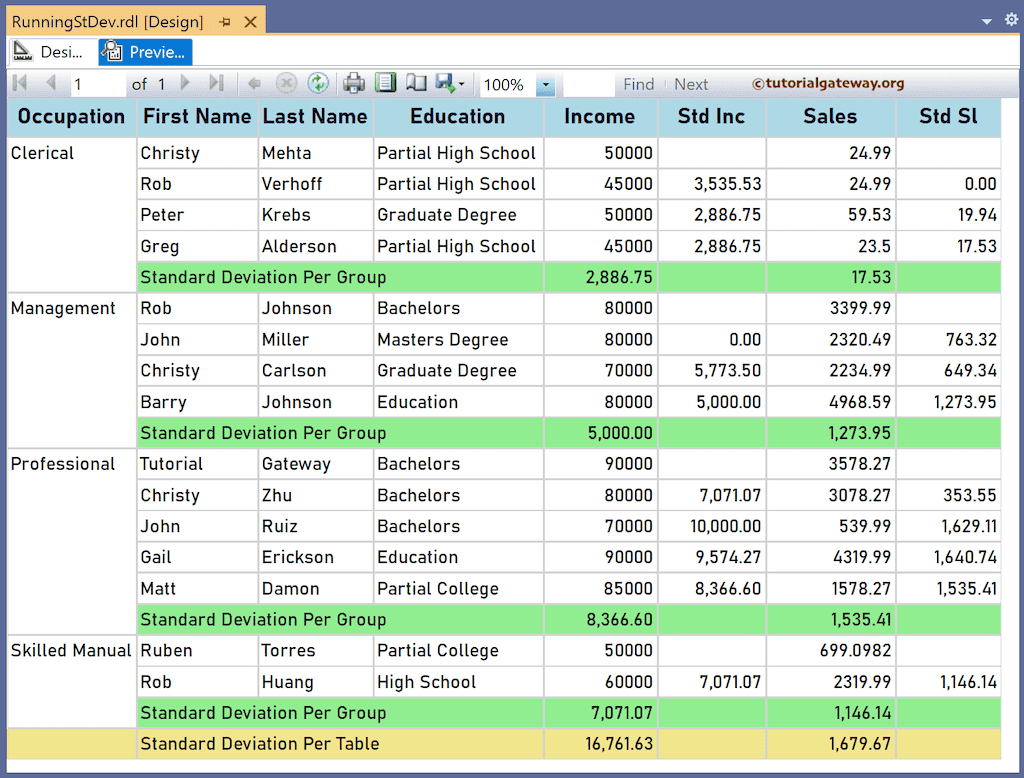
Similarly, right-click the textbox under the Std Inc and write the below expression. The code below will find the running Standard Deviation of the YearlyIncome for each Occupation group. For more functions >> Click Here!
=RunningValue(Fields!YearlyIncome.Value, StDev, "Occupation")
Please click the preview tab to see each Occupation group’s running Standard Deviation of the Employee Income and Sales.
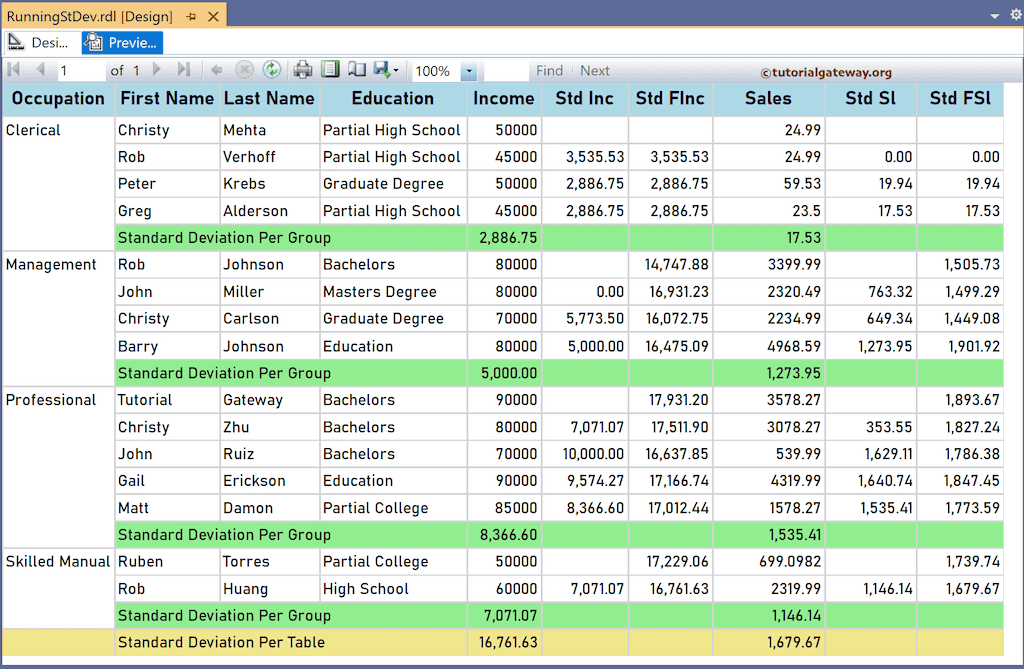
Let me create two more new SSRS columns and name them Std FInc and Std FSl to calculate the running Standard Deviation for the whole table. To do so, you must replace the group name (“Occupation”) with the table name (“Tablix1”) or DataSet name (“DSet”). First, add the below RunningValue expression for the textbox under the Std FInc header.
=RunningValue(Fields!YearlyIncome.Value, StDev, "DSet")
Similarly, write the following expression for the textbox under the Std FSl to find the running Standard Deviation of the table sales.
=RunningValue(Fields!Sales.Value, StDev, "DSet")
The report below calculates the running Standard Deviation of the income and sales for the individual occupation group and the complete employee table.
SSRS Running Population Standard Deviation
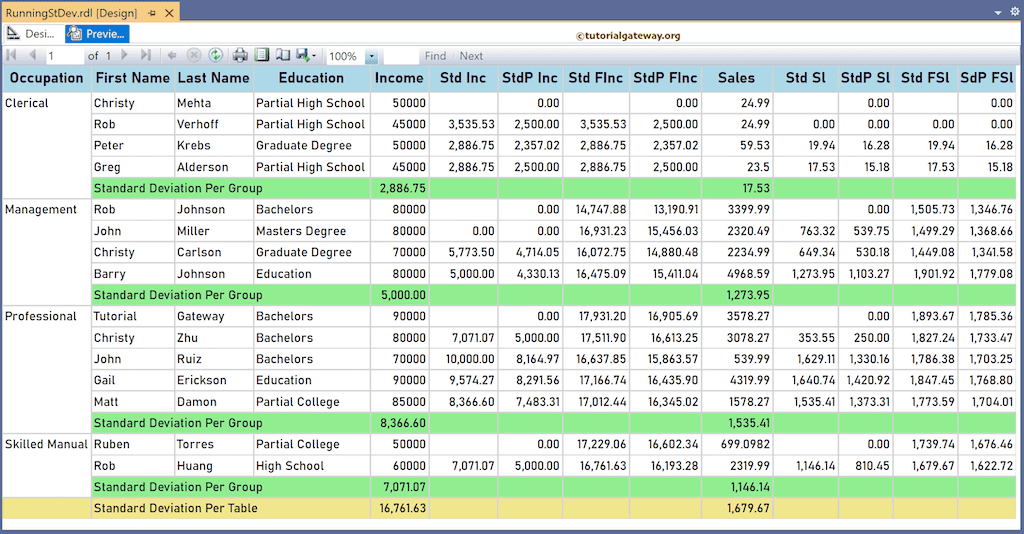
To do so, create four more new columns and name them StdP Inc, StdP Sl, StdP FInc, and StdP FSl. Next, for the Population Standard Deviation, we must use the StDevP aggregate function inside the RunningValue function.
The StDevP expression to calculate the Running Population Standard Deviation of the Income and Sales for each Occupation group.
=RunningValue(Fields!YearlyIncome.Value, StDevP, "Occupation")
=RunningValue(Fields!Sales.Value, StDevP, "Occupation")
Use the two StDevP RunningValue expressions below to find the running population standard deviation of the income and sales for the whole table.
=RunningValue(Fields!YearlyIncome.Value, StDevP, "DSet")
=RunningValue(Fields!Sales.Value, StDevP, "DSet")