This SSRS article explains how to calculate the running percentage in a particular group or complete table using RunningValue and arithmetic calculations with an example.
To demonstrate the Running percentage, we use the Employee table below, which has 15 records grouped by Occupation. The image below shows the records in the Table report.

SSRS Running Percentage Example
For this, let me add a new column to the right side of the Income and Sales and name headers RP Inc and RP Sl. Next, right-click the textbox under RP Inc and choose the Expression option. To understand the report, I suggest you refer to the Charts, Table, Grouping, and Format Table articles in SSRS.
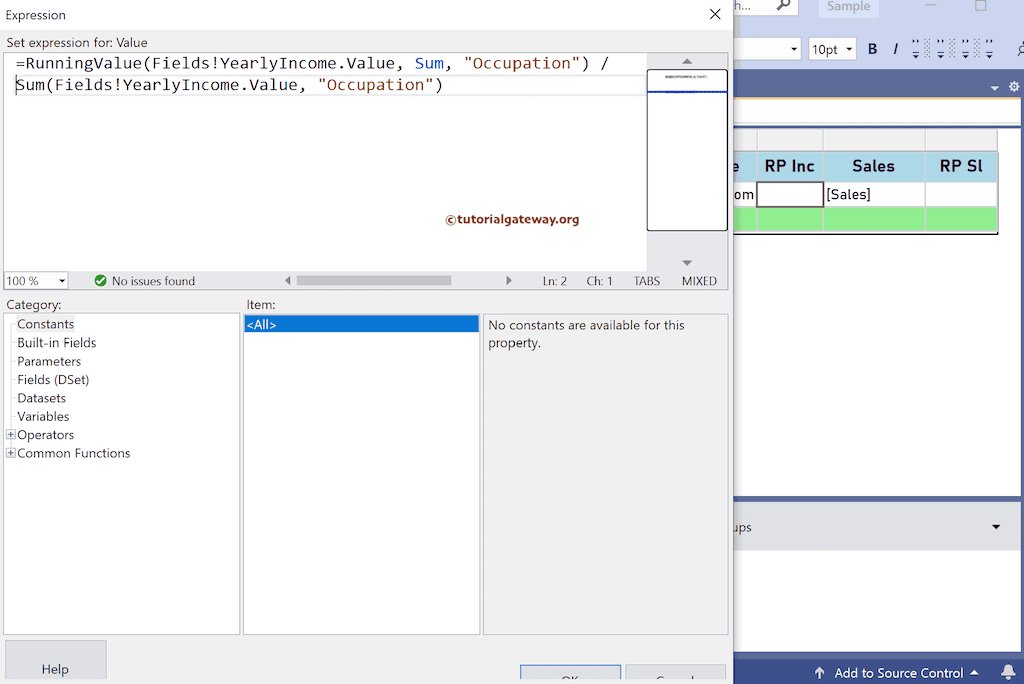
It opens the following SSRS expression window to calculate the running percentage. To get the same, we must use the RunningValue and Sum functions. The RunningValue code below calculates the employee income running total in the Occupation group. Next, we divide the running total at each point by the total group yearly income to calculate the running percentage for each Occupation group.
=RunningValue(Fields!YearlyIncome.Value, Sum, "Occupation") / Sum(Fields!YearlyIncome.Value, "Occupation")
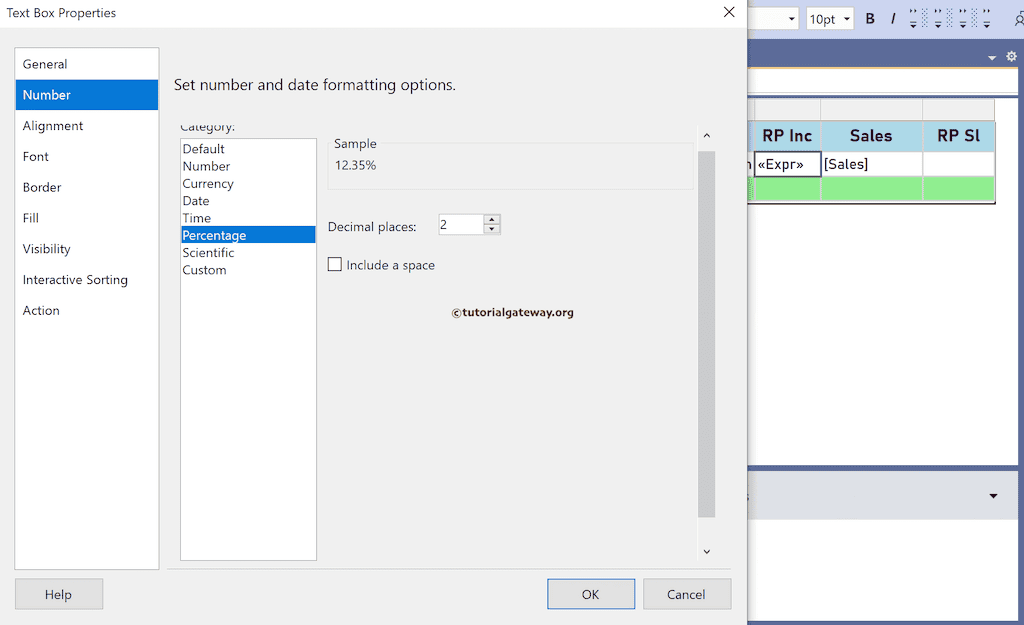
Right-click the textbox under RP Inc and choose the Text Box Properties option. Next, change the Number format from Default to Percentage and add two decimal places. It will add the percentage symbol.
Similarly, right-click the textbox under RP Inc. Next, write the SSRS expression below to find the running percentage of employee sales for each Occupation group.
=RunningValue(Fields!Sales.Value, Sum, "Occupation") / Sum(Fields!Sales.Value, "Occupation")
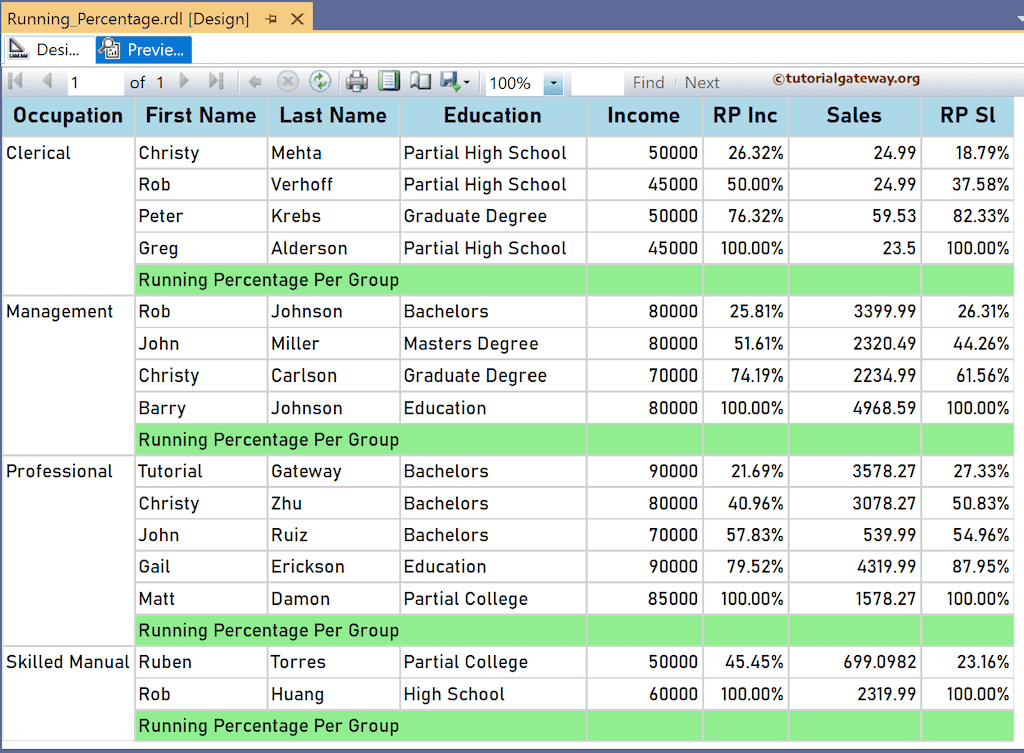
Please click the preview tab to see the running percentage of the employee’s yearly income and sales for each occupation group. For more functions >> Click Here!
Let me create two more new columns and name them TRP Inc and Var TRP Sl to calculate the running percentage of the whole table. To do so, you must replace the group name (“Occupation”) with the table (“Tablix1”) or DataSet name (“DSet”). First, add the expression below for the textbox under the TRP Inc header. Next, format the text box number property to percentage.
=RunningValue(Fields!YearlyIncome.Value, Sum, "DSet") / Sum(Fields!YearlyIncome.Value, "DSet")
Similarly, write the following SSRS expression for the textbox under the TRP Sl header to find the running percentage of the employee sales. Again, format the text box number property to percentage.
=RunningValue(Fields!Sales.Value, Sum, "DSet") / Sum(Fields!Sales.Value, "DSet")
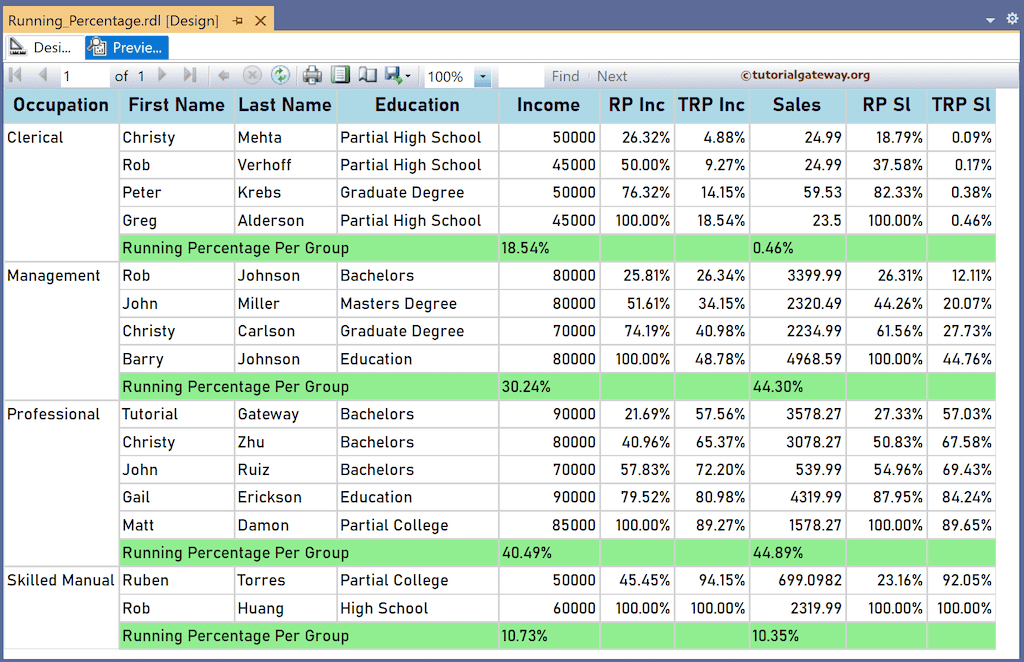
The report below calculates the running percentage of the income and sales columns for each occupation group and the complete employee table.

The two expressions below calculate the running percentage for the complete occupational group against the table.
=FormatPercent(Sum(Fields!YearlyIncome.Value, "Occupation") / Sum(Fields!YearlyIncome.Value, "DSet"), 2)
=FormatPercent(Sum(Fields!Sales.Value, "Occupation") / Sum(Fields!Sales.Value, "DSet"), 2)
The report preview shows the same.
Use the expressions below to show 100% in each Occupation group’s Running Percentage Per Group row.
=FormatPercent(Sum(Fields!YearlyIncome.Value, "Occupation") / Sum(Fields!YearlyIncome.Value, "Occupation"), 2)
=FormatPercent(Sum(Fields!Sales.Value, "Occupation") / Sum(Fields!Sales.Value, "Occupation"), 2)