The SSRS Avg Function is an aggregate function that returns the average of all numeric not-null values from the given field. This article explains how to use the Avg Function to find the average of a particular group or complete table with an example.
The syntax of the SSRS Avg Function is as shown below. To find the average with the Default scope
Avg(Fields!SalesAmount.Value)
To Find the Average for each Group, Table, or Data Set, replace the name with the Group, Tablix, or Data Set name.
Avg(Fields!SalesAmount.Value, "Name")
Avg(Fields!SalesAmount.Value, "Name", Recursive)
We use the Employee table below to demonstrate the SSRS Avg Function. It has 15 records grouped by Occupation. The image shows the records in the Table report.

SSRS Avg Function Example
Right-click the YearlyIncome or Sales field, choose the Insert a Row option, and select the Outside Group—Below option to add a new row. Next, Merge the first three columns and add Average as the text. To understand the report, I suggest you refer to the Charts, Table, Grouping, and Format Table articles in SSRS.
There are multiple ways to write the SSRS Avg function. The first approach is to click the cell and choose the YearlyIncome, and it will add the Sum function to it because it is the default aggregate function. So, select the Text (Sum(YearlyIncome)), choose Summarize by, and click the Avg function. It internally writes the below expression:
=Avg(Fields!YearlyIncome.Value)

The second approach is to right-click the textbox and choose the Expression option. For instance, right-click on Sum(Sales) and choose the Expression.
It opens the following expression window, where we write the more complex SSRS Avg function along with the scope. The code below returns the sales average.
=Avg(Fields!Sales.Value)

Please click the preview tab to see the employee’s average yearly income and sales average. If you observe the report, by default, it calculates the average for each Occupation because it is the default scope. For more functions, Click Here!
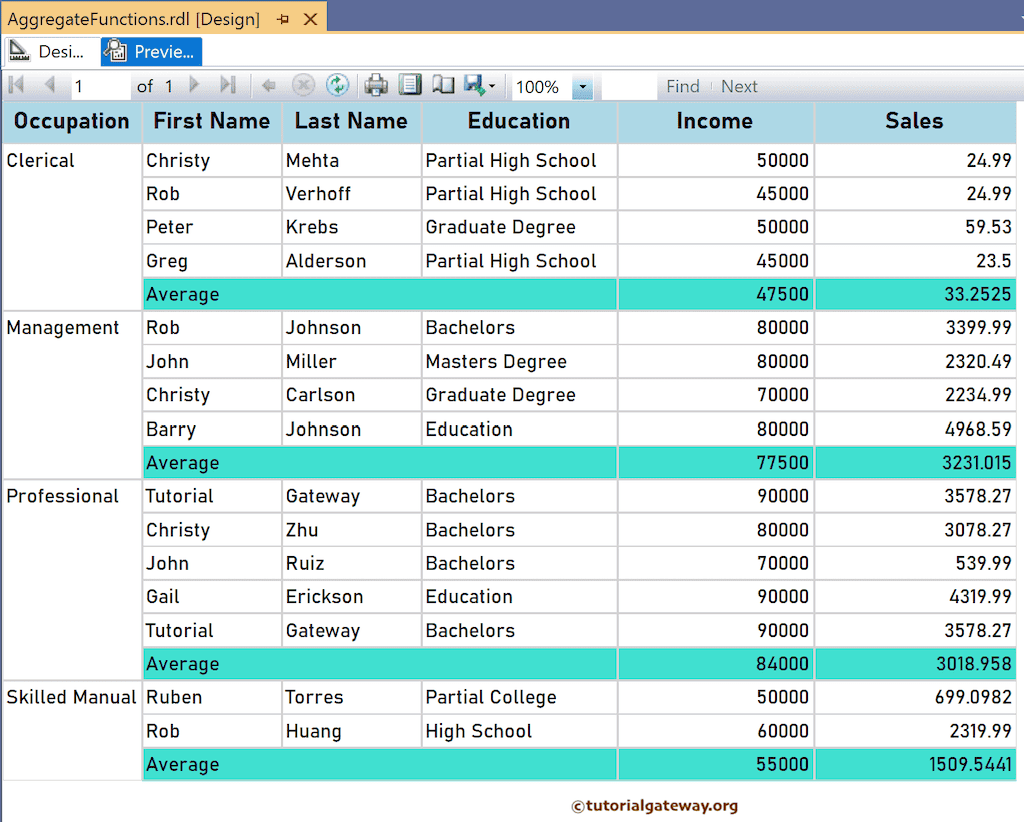
SSRS Avg Function Scope Demonstration
For this, let me add a new column to the right side of the Sales and name the header as the Avg Sale. Next, right-click the textbox and choose the Expression.
The expression below returns the same result as shown by the Average row, which is the average for each group. However, you have more control over the average calculation because we manually changed the Avg function scope.
=Avg(Fields!Sales.Value, "Occupation")
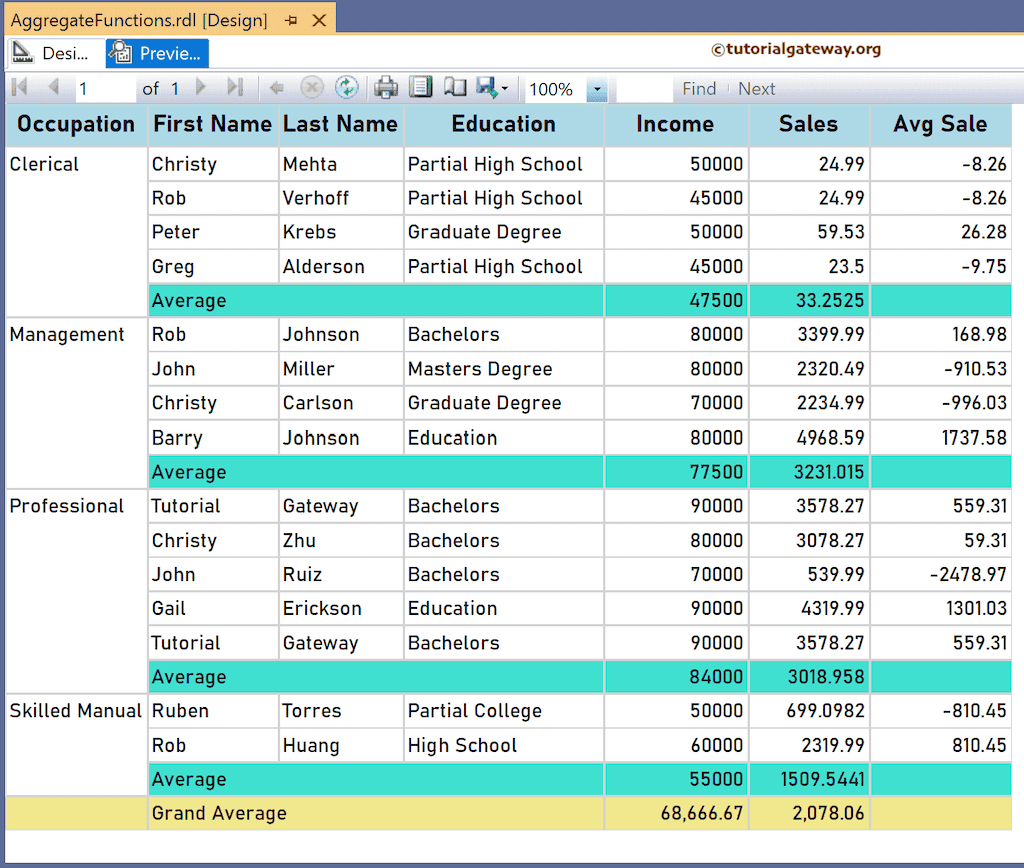
The SSRS Avg function below subtracts each occupation group’s average sales from the individual employee sales. Remember, “Occupation” is the group name.
=Fields!Sales.Value - Avg(Fields!Sales.Value, "Occupation")

As mentioned earlier, to find the average of the whole table or all the employees, you must replace the group name (“Occupation”) with the table name (“Tablix1”). Let me add an extra row outside the Group to add the two Avg function expressions below for the Yearly Income and Sales.
=Avg(Fields!YearlyIncome.Value, "Tablix1")
=Avg(Fields!Sales.Value,"Tablix1")
The report below shows the average of all the groups. Please replace Tablix1 with the Dataset name to get the sales average regardless of the filters applied to the report. If you check the report preview, the Average Sales of Christy Mehta is 24.99 (Sales)—33.2525 (Clerical Average) = -8.26.