The Informatica Workflow Monitor is used to monitor the execution of Workflows or Tasks assigned in the Workflow. Generally, the PowerCenter helps you to track or monitor the Event Log information, list of executed Workflow, and their execution time in detail.
To open the Workflow Monitor, Please Go to the Start menu -> All Programs -> Info -> PowerCenter Workflow Monitor. Once you click on that, the following window opens.
From the screenshot below, we divided the Informatica PowerCenter Workflow Monitor screen into four sections to explain each section in detail. Let us see them individually,
- Navigator: It allows us to connect with the Repository services and navigate between Different Workflow.
- Workflow Run: This section helps you to monitor the Workflow execution
- Output window: In this section, You can see the steps that we performed in this Workflow Monitor.
- Properties Window: It will display information about the current Informatica operation.
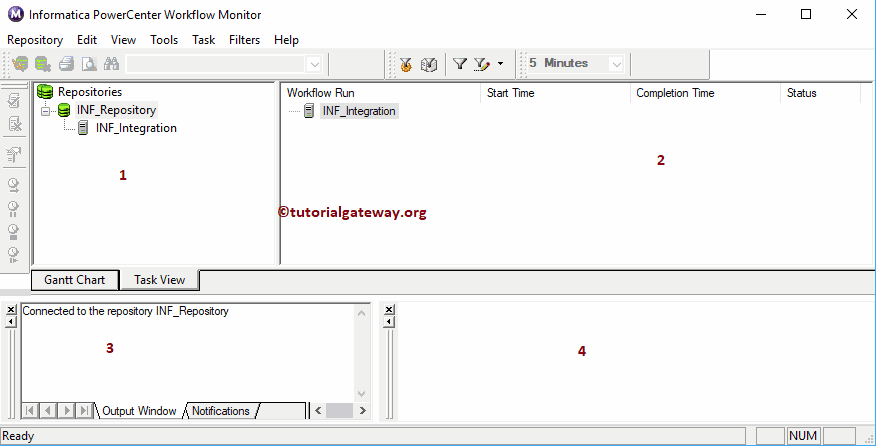
Informatica Workflow Monitor
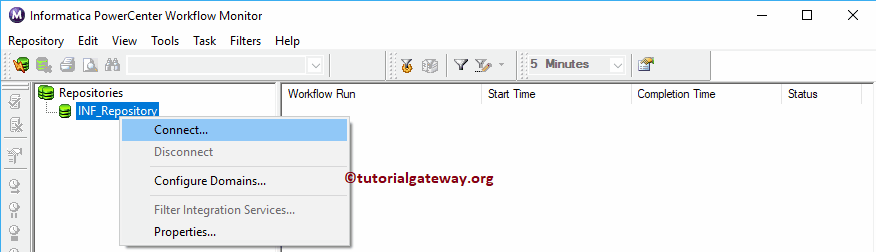
Before we start anything, we have to connect with the Repository Service. So, Please select and Right-click the PowerCenter Repository Service (INF_Repository) under the repository section and select the Connect option
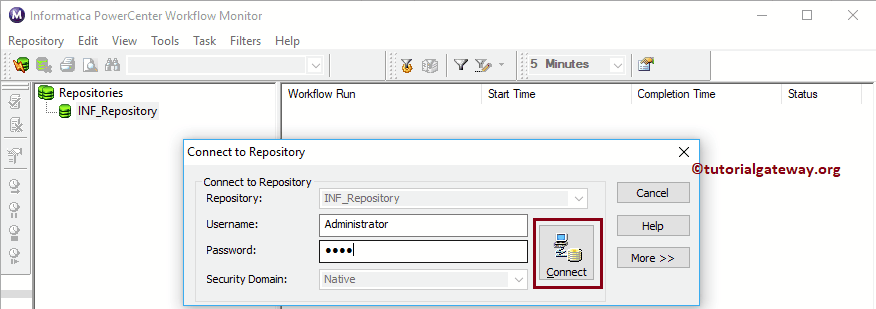
To connect with the Informatica Workflow Monitor, provide the Admin Console credentials. So, Please provide the Username and Password.
TIP: Here, you have to provide the Admin Username and password that you specified while installing the Server.
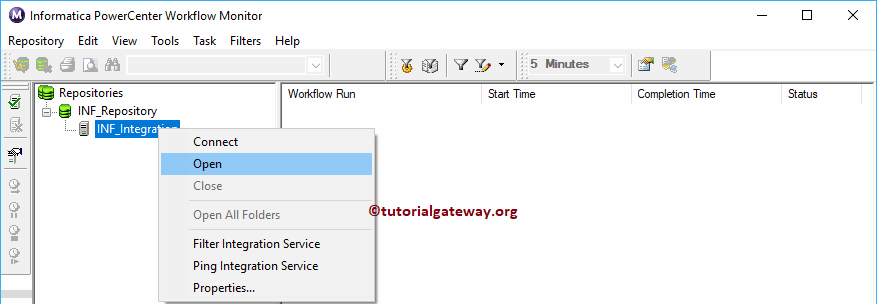
Once you connect successfully, the following window will display. If you observe the below screenshot, you can see the Integration Service. To see the existing Workflow, right-click on the Integration Service and select Open from the Context menu.
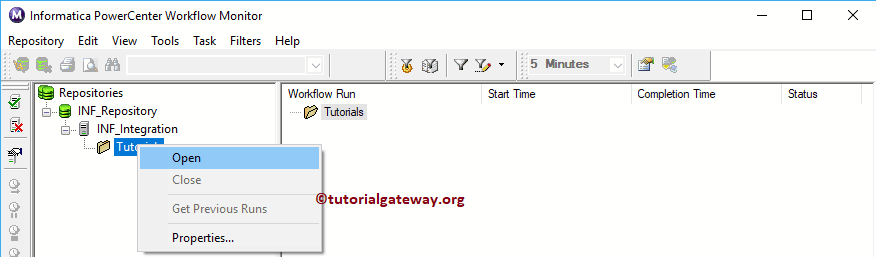
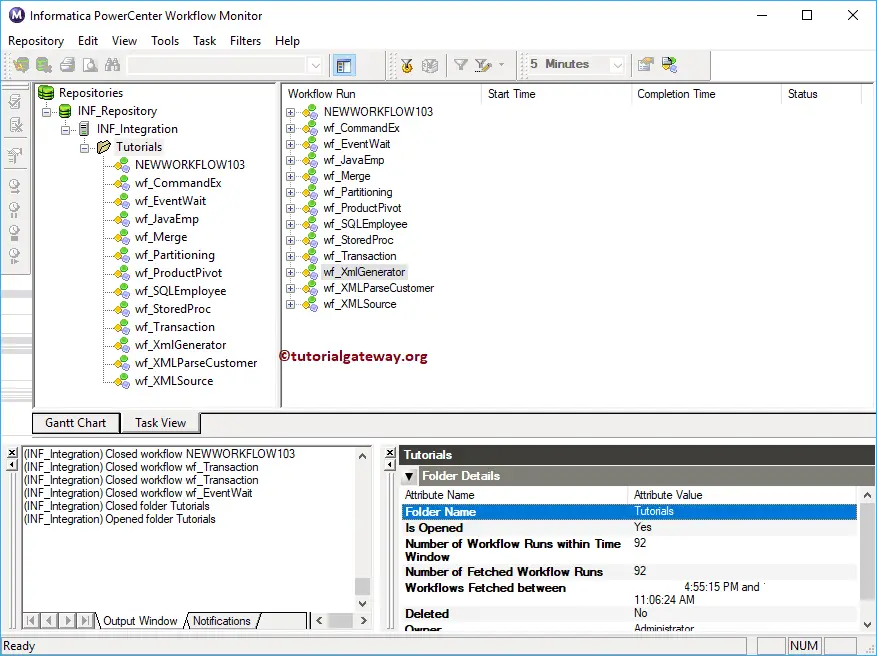
Now you can see the folders in Workflow Monitor. To see the existing Workflows or to run them, right-click on the folder and select Open from the menu.
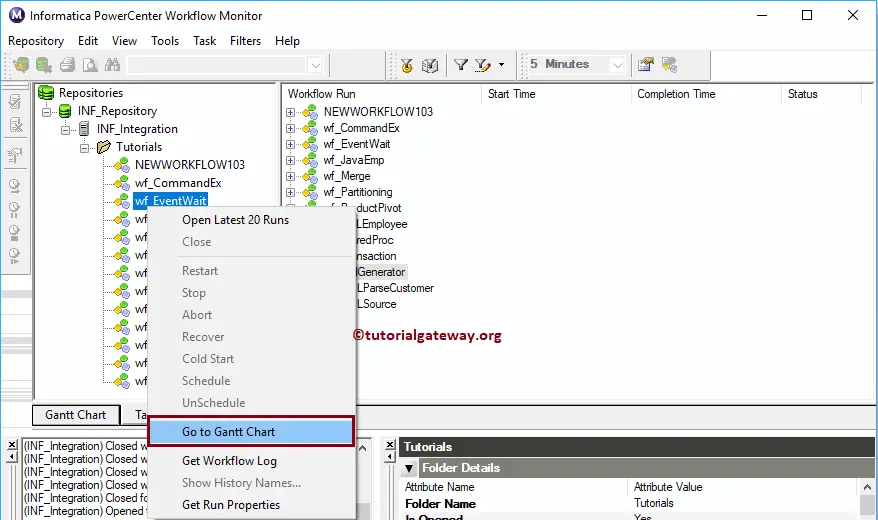
Expand the individual Workflow to see the previous execution details, i.e., Workflow Run start Time, Completion Time, and Run Status.
Informatica Workflow Monitor provides a Gantt Chart to see the execution in detail. To view, right-click on Workflow and select Go to Gantt Chart from the context menu.
Now you can see the Informatica Workflow run in the Gantt Chart.
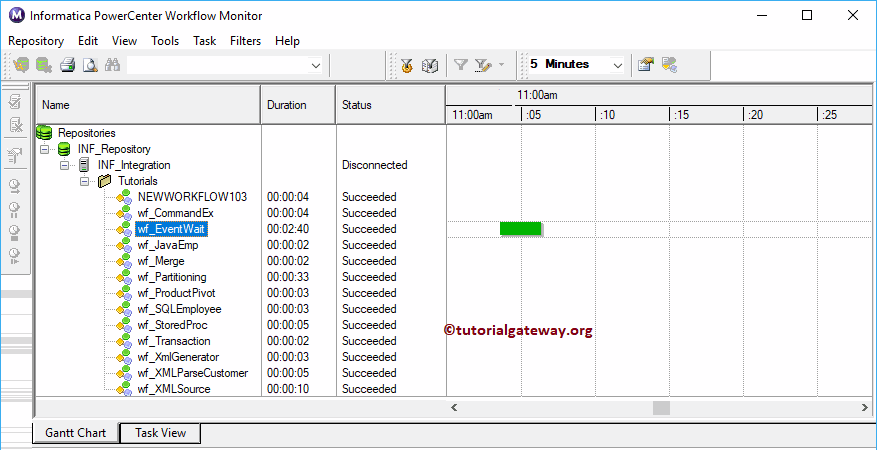
You can see the information in the properties window by selecting Workflow.
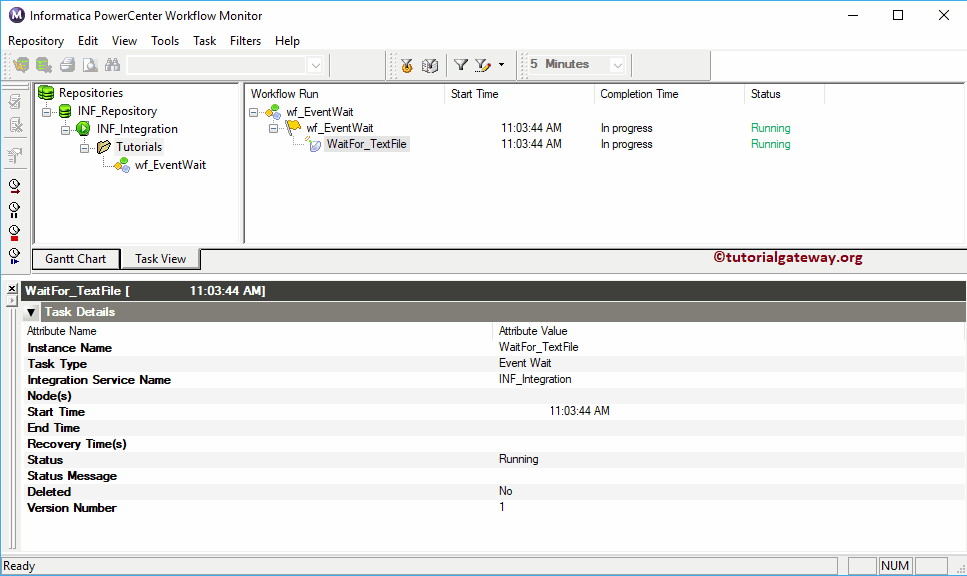
Let me remove the Output window to explore the Properties window information. Next, we are running the Event Wait Task workflow to show the Workflow run. From the below screenshot, you can observe that under the Task details tab, you can see all the information about the task.
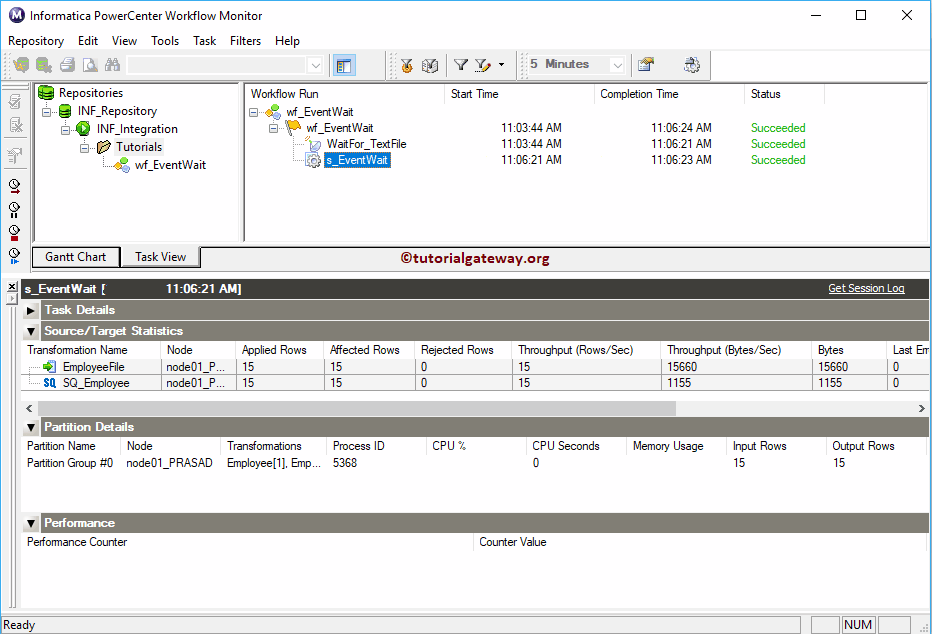
Under the Source or Target Statistics, you can see the Row flow. I mean, the number of rows passed, failed, etc. Next, under the partition tab, you can see the partition information (if any). Use the Performance tab to check the performance of any task
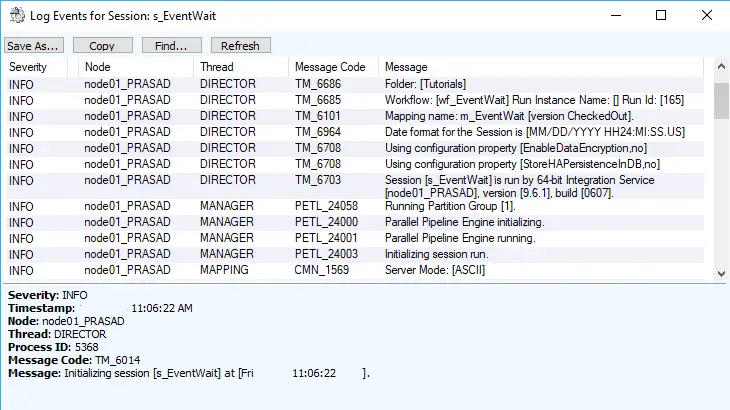
To see the details Event log of any task, right-click on the Task. Next, select the Get Session Log from the context menu.
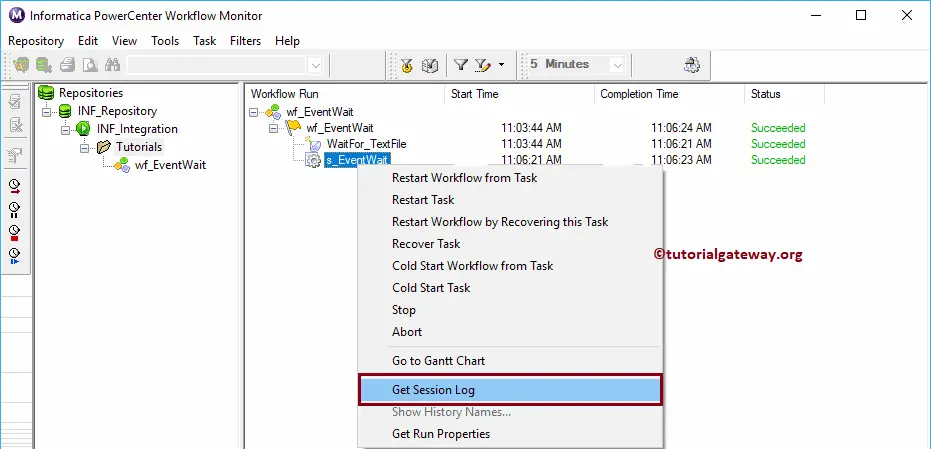
You can see the detailed event log in the Informatica workflow monitor. Generally, we used this Session log to check the error position. I mean, at what position does an error throw, and the reason for it?