The Data Profiling Task in SSIS is used to compute various profiles that help us become familiar with the data source and identify the problems in the data (if any) that must be fixed. We show you how to profile the source data using this SSIS Task with an example.
The Data Profiling Task in SSIS will work only with the SQL Server. Therefore, the Data Profiling Task doesn’t support the data in the file system or any third party.
Data Profiling Task in SSIS Example
Drag and drop the SSIS Data Profiling Task into the Control Flow region, as shown below.
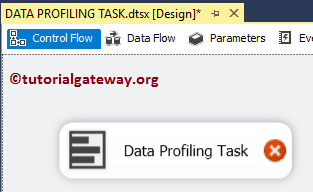
Double click on it will open the SSIS Data Profiling Task Editor to configure it.
- Time-out (in seconds): Please specify the connection time-out in seconds. If the connection takes more than this time, the connection will fail.
- OverwriteDetination: This SSIS Data Profiling Task property has two options: True and False. If we set this property to true, the File System Task will overwrite the existing files in the Destination path.
- Open Profile Viewer: This button shows the profiling data after you run the integration service package.
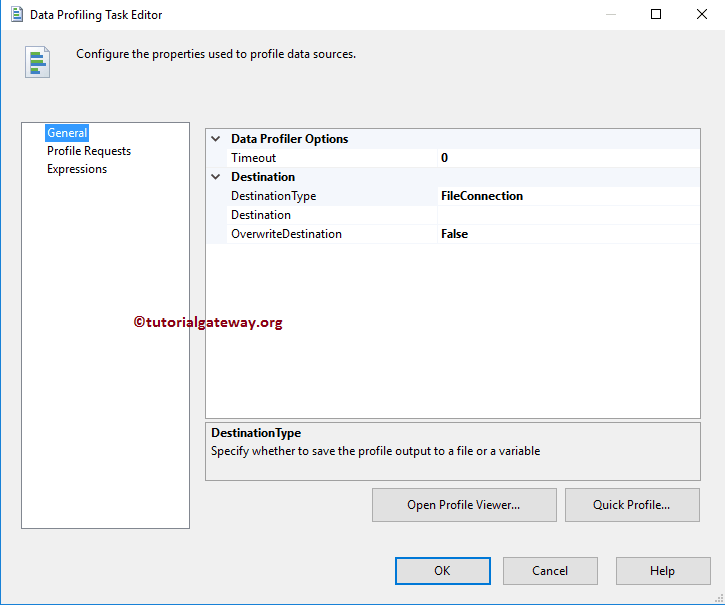
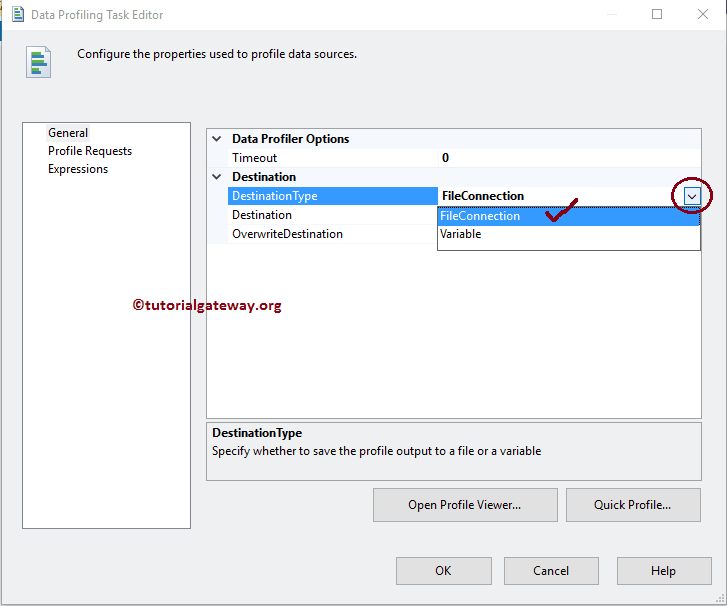
DestinationType: This SSIS Data Profiling Task property has two options: File Connection and Variable. If we set this variable to true, Destination data will be stored in a variable. If we put it to File Connection, please select the Destination file manually using File Connection Manager.
When you set the DestinationType to File Connection, we have to configure the Destination Connection using Destination Property. If you have already created the File Connection Manager, select it from the drop-down list.
If you haven’t created any connection Manager before, You have to make one by selecting <New Connection..>.
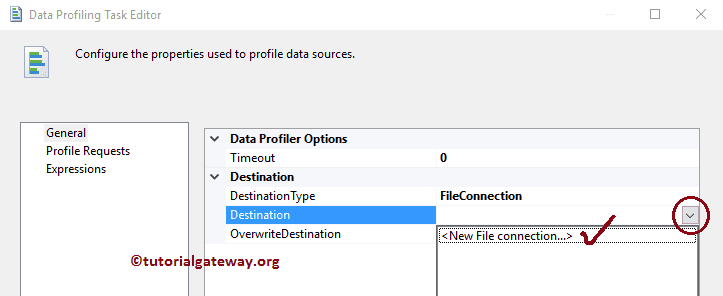
Once you click on the <New Connection..> option, the File Connection Manager Editor will open to configure the Destination Connection.
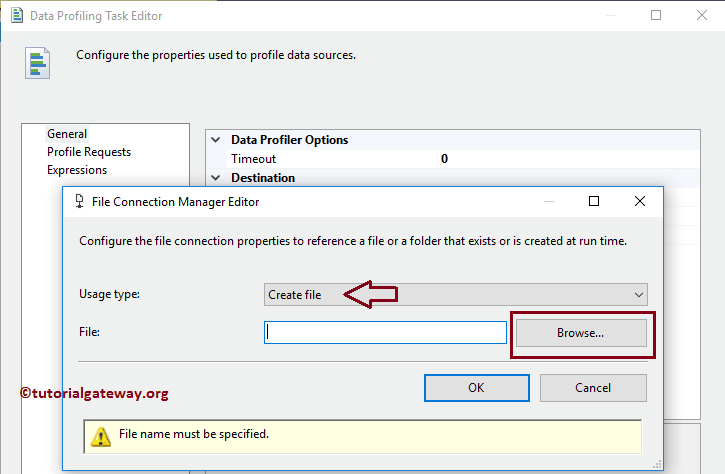
Select the Existing File option from the Usage Type if you have any existing SSIS Data Profiling Task files. Otherwise, select the Create File option and Click the Browse button to select the Existing File from the file system or create a new file.
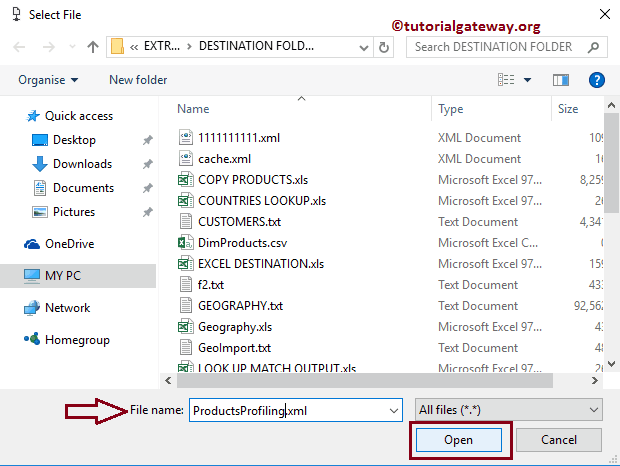
From the above screenshot, you can observe that we created the ProductsProfiling.xml file inside the Destination Folder.
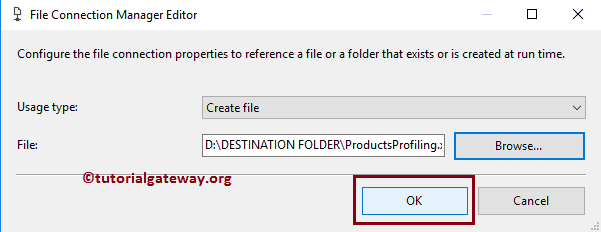
Click OK to finish configuring the Source connection. If you have difficulty understanding, please refer to the File Connection Manager article.
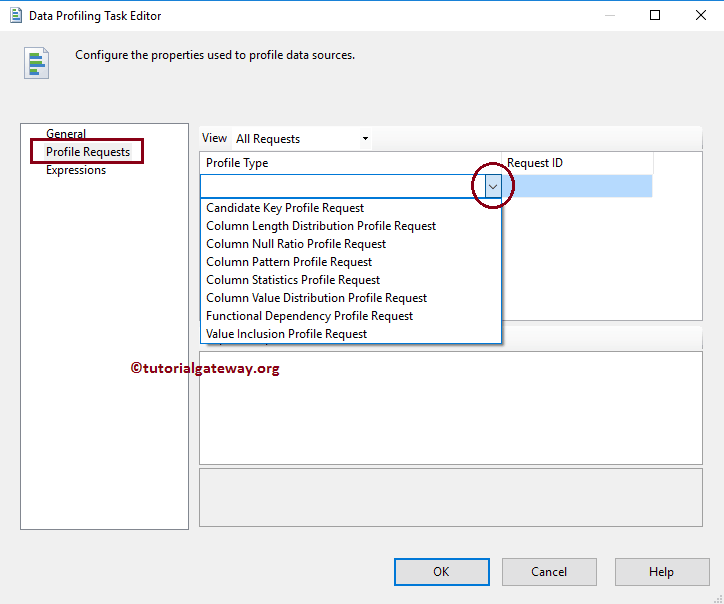
The Data Profiling Task computes eight different ones.
The following table will show you the list of available ones in the SSIS Data Profiling Task and the description.
| SSIS Data Profiling Task | Description |
|---|---|
| Candidate Key Profile | This SSIS data profile task will report the percentage of Null Values in a Column. It is helpful to check which column is holding the highest Nulls (analyze the data) |
| Column Length Distribution | Report the extent to which the values in the dependent column depend upon the values in the determinant column (it may be one or a set of columns). It is handy to identify whether the column data is valid or not. For example, if you profile the dependency between a column that contains India Zip Codes and columns that contain states in India. Your data is invalid if your dependence finds multiple states for the same zip code. |
| Column Null Ratio | This SSIS data profile task will report the percentage of Null Values in a Column. Helpful to check which column is holding the highest Nulls (analyze the data) |
| Column Pattern | It will report the set of RegExp (regular expressions) that cover the specified percentage of values in a string column. |
| Column Statistics | This SSIS Data Profiling Task profile reports the statistics, such as Minimum value, Maximum Value, Mean and Standard Deviation of every Numeric Column, and Minimum value and Maximum Value for the Datetime columns. Useful to check whether the Date column is holding correct data or not. |
| Column Value Distribution | Reports all the distinct values available in our selected column and teaches value’s percentage of rows Crucial to identify whether the column data is valid or not. For example, if your column is supposed to store states in the United States, and if you discover more than 50, your data is incorrect. |
| Functional Dependency | Report the extent to which the values in the dependent column depend upon the values in the determinant column (it may be one or a set of columns). It is handy to identify whether the column data is valid or not. For example, if you profile the dependency between a column that contains India Zip Codes and columns that contain states in India. Your data is invalid if your dependence finds multiple states for the same zip code. |
| Value Inclusion | This profile will compute the values overlapping between two columns or two sets of columns. First, recognize whether the column is appropriate to serve as the foreign key between two columns or not. |
Please go to the SSIS Data Profiling task General Tab. Next, click on the Quick Profile button to create a new one.
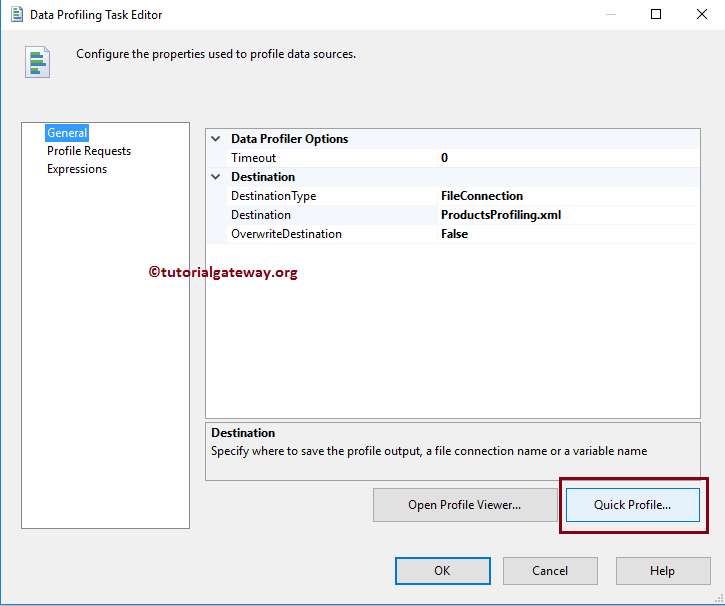
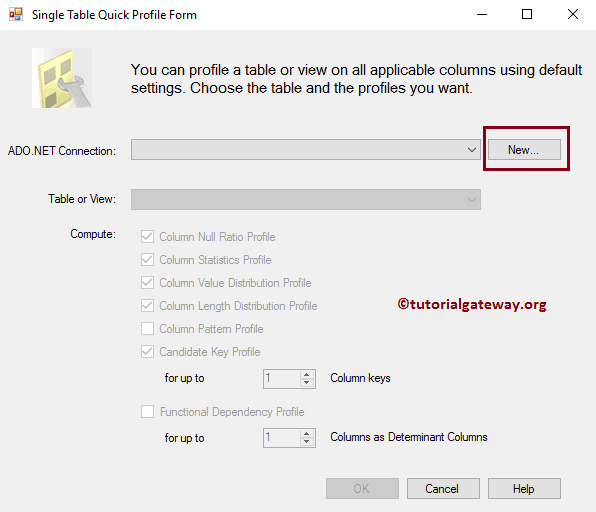
Once you click the button, a new window called Single Table Form opens. Click on the new button and open another Connection Manager window to select the Provider, Server Name, and Database Name. If we created any connection managers before, select them from the drop-down list.
Here, we are selecting the already created ADO.NET connection. If you have difficulty understanding the steps, please refer to the ADO.NET connection manager tutorial.
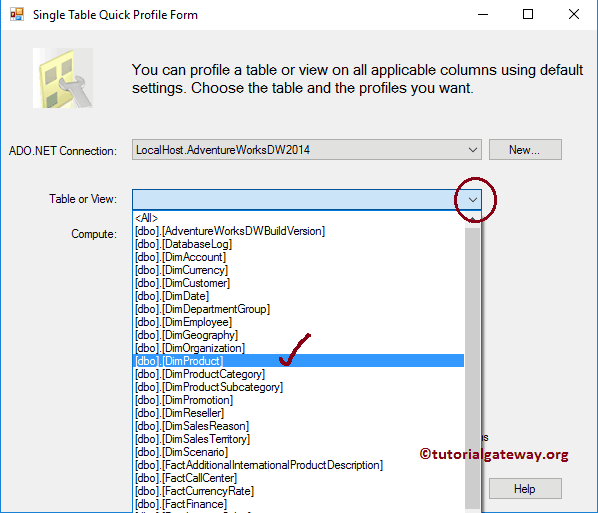
Here, we are selecting the SQL DimProduct table.
The above screenshot shows that we use our local host Windows account as the server name. Next, [AdventureWorksDW2014] is the database name.
NOTE: In real-time, you must select the Use SQL Server Authentication option and provide the valid credentials your Admin person gave.
Here, we select all the available options.
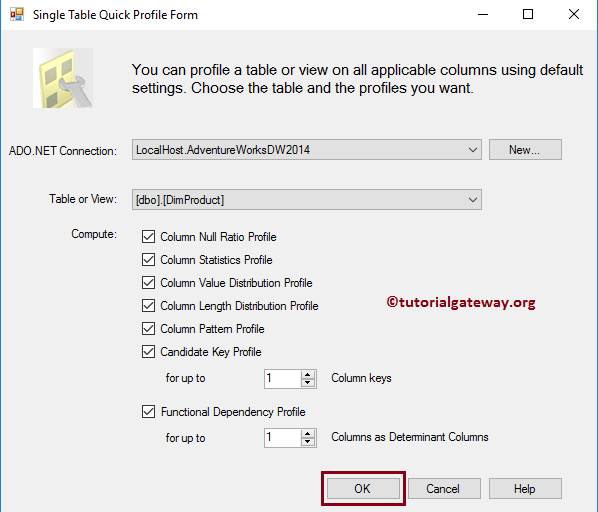
Once you click the OK button, the SSIS Data Profiling Task Editor will navigate to the Profile Requests Tab.
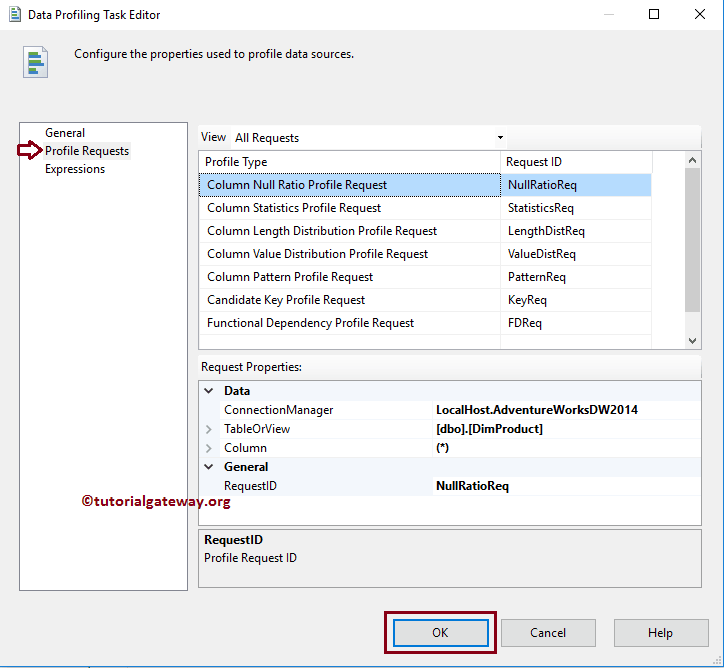
Click OK to finish configuring and closing SSIS Data Profiling Task Editor. Let us run the package and see.
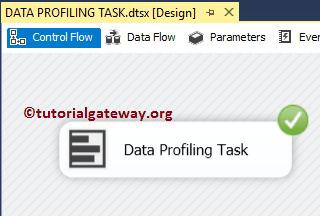
As the above screenshot shows, the SSIS Data Profiling task package executes successfully.
We need the Data Profile Viewer to see the Task generated one.
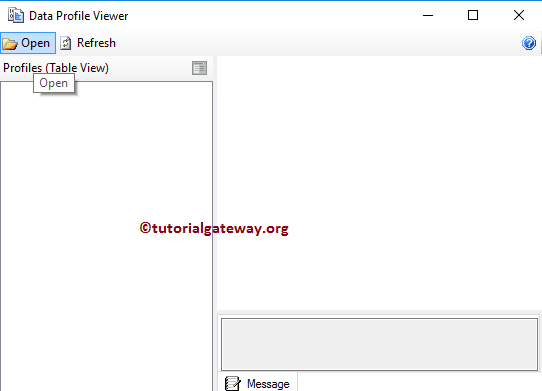
Please use the search bar and type Data Profile Viewer or navigate to C:\ProgramData\Microsoft\Windows\Start Menu\Programs\Microsoft SQL Server 2014\Integration Services. Double-click on it will open the following window.
To view this, please click on the Open folder. Select the XML file that the Data Profiling Task generated.
The screenshot below shows the list we selected while configuring the SSIS Data Profiling Task package.
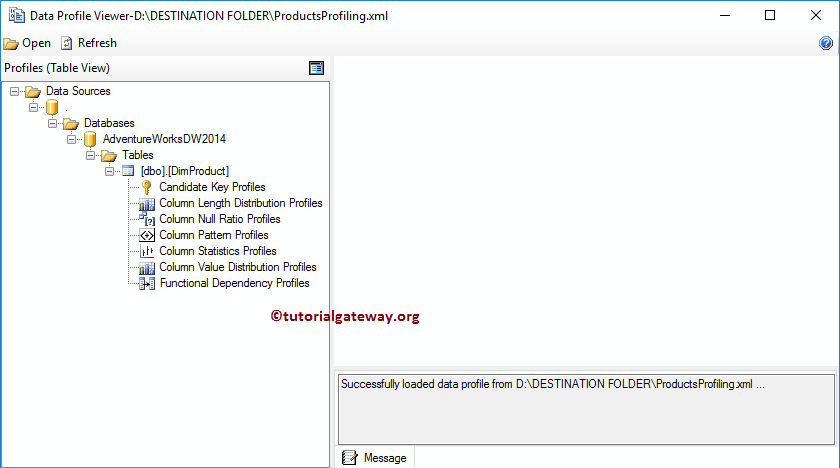
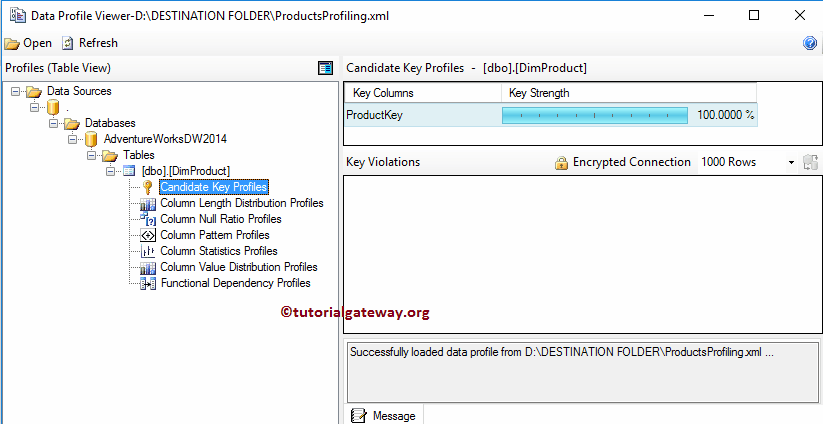
Candidate Key Profiles: This will report whether a column or set of columns is an approximate Key or a key for the selected data. In our table chosen, (DimProducts) Product key is the key column. Its key strength is 100%, which means the data is valid.
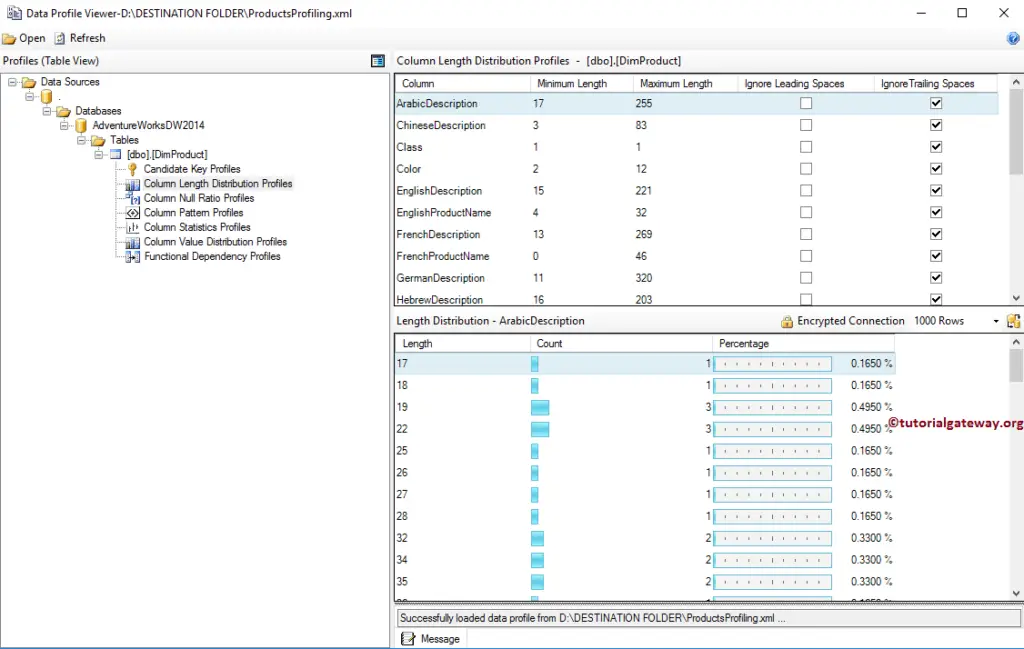
Column Length Distribution: This SSIS Data Profiling Task report has two sections:
- Column Length Distribution: The report will display every column’s minimum and maximum length in our selected table.
- Length Distribution: This will report all the distinct string lengths available in our selected columns and the percentage of rows representing the same length.
Here, we selected the Arabic Description Column. And you can see it has distinct lengths of 17, 18, 19 …., and 19, 22 length holds the highest percentage. It means we can assign the destination string length as 25 (rather than 255) while transferring data.
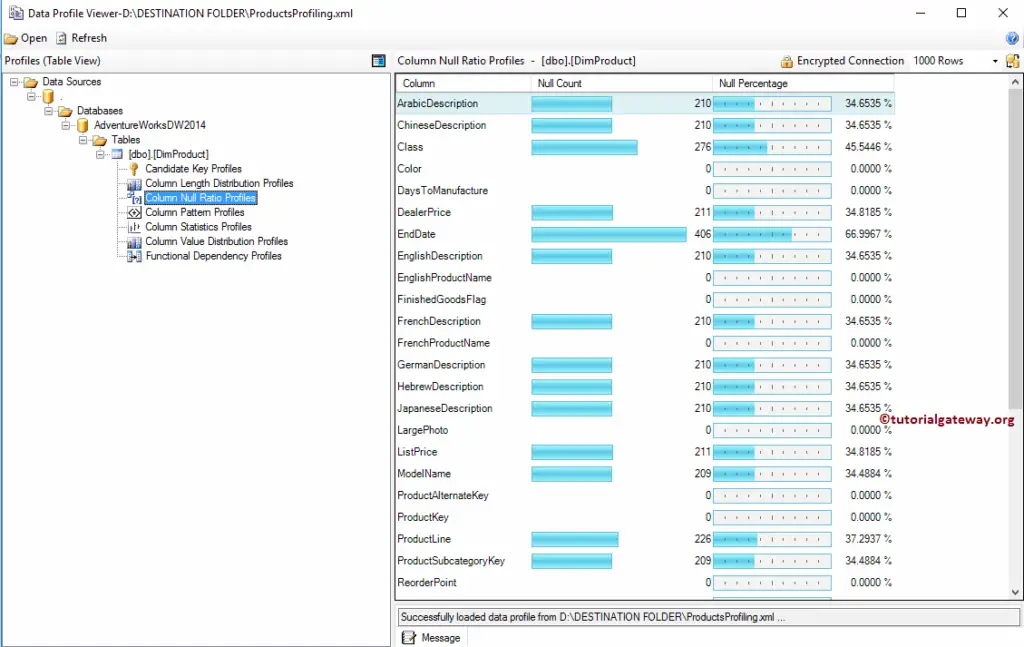
Data Profiling Task Column Null Ratio Profiles: This will report the percentage of Null Values in a Column. The image below shows that the End Date has the highest percentage of NULLS, Color, Days to manufacture, English and French Product Name, Product Key, Product Alternate Key, Photo, and Finished Good Flag has no Nulls.
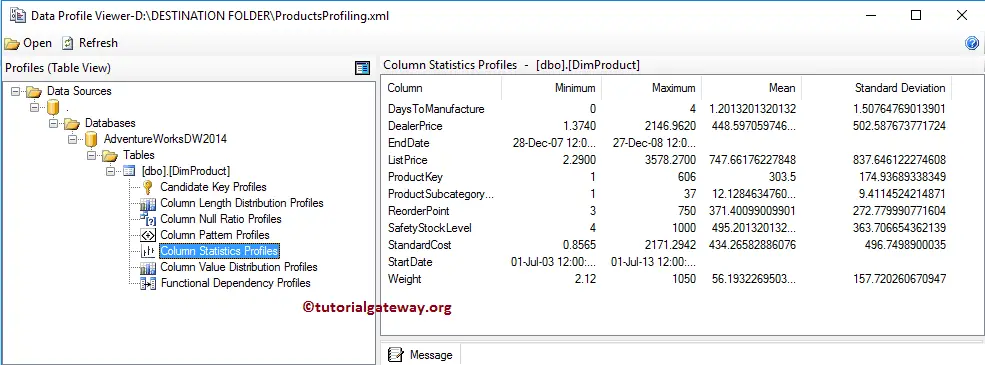
Column Statistic Profiles: This will report the statistics, such as Minimum value, Maximum Value, Mean, and Standard Deviation of every Numeric Column. Also, Minimum Value and Maximum Value for the Datetime columns.
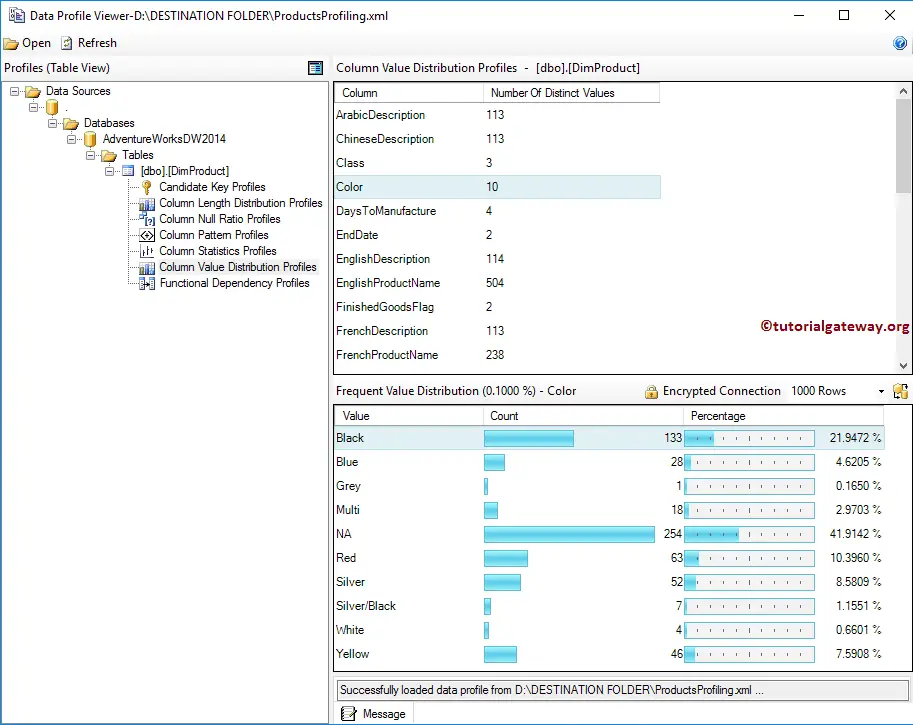
Column Value Distribution: This SSIS Data Profiling Task report has two sections:
- Column Value Distribution: The report displays the Number of Distinct Values in each column in our selected table.
- Frequent Value Distribution: It will report all the distinct values in our selected columns and the percentage of rows representing the same value.
From the screenshot below, you can see that we selected the Color Column, which has distinct values of 10. The NA row holds the highest percentage here, followed by Black.
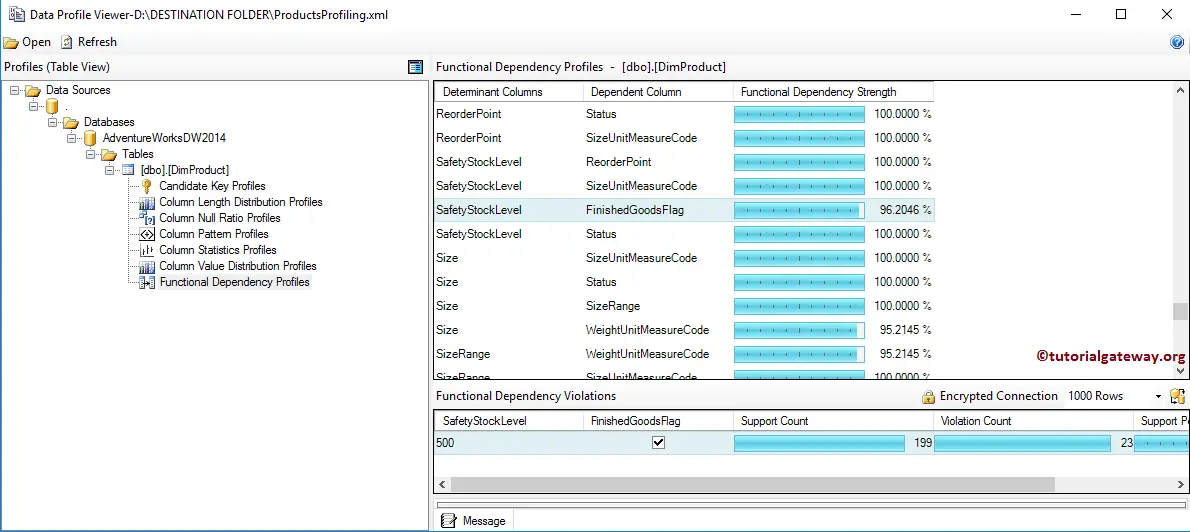
Functional Dependency: This will report the extent to which the values in the dependent column depend upon the values in the determinant column (it may be one or a set of columns).

Comments are closed.