The Donut Chart in Tableau is similar to a pie chart with a circle in the middle. Pie charts compare the measures using the area or size, where the larger the pie size, the more sales. On the other hand, Donut Charts display the measure using the length of a bar where the highest sale has the largest bar. It means you can quickly identify which category or segment performs better. Tableau Donut Charts are very effective in real-time when comparing two or three values and visualizing the KPIs or Goals versus actual.
The Tableau Donut chart is also known as a Doughnut chart, and the name comes from its shape, which replicates the actual donut. You can use the outer circle to display the Goals, Sales, and Orders against the dimension. At the same time, the empty central space helps to show the total sales or percentages. The size of each segment in an outer circle depends on the Measure value (sales, orders, etc).
Nowadays, Donut charts are becoming popular because of their attractive visuals. Although there is no direct Show Me window method, you can create a Donut chart in Tableau in multiple ways, and this article covers them with detailed information. For this demonstration, we used the superstore Excel file.
Create a Donut Chart in Tableau
There is no predefined supporting option in the Show Me window, so we must create them manually. So, before we start creating a Tableau Donut Chart, we must first create a calculated field of Zero value. To do so, go to the Analysis Menu, click the Create Calculated Field option, and assign any name (ZeroCal) and hardcode zero as the value.

For this Donut Chart, we need two axes, one for a pie chart and the other for an empty circle in the middle. So, drag that Tableau calculated field (ZeroCal) multiple times to the rows shelf. This calculated field will divide the sheet into two equal sections. For more Charts, Click Here.

For example, if you observe the above Tableau Donut Chart Marks card section, we have All, SUM(ZeroCal), and SUM(ZeroCal)(2) sections where All belongs to both fields. However, you have the leverage to select the particular calculated field to work with them.
First, select All (applied to both fields) from the Marks card section, change the Mark Type from Automatic to Pie, which shows two pie charts, and add Sales to the Labels shelf. It will convert both axis charts to pie charts with the sum of the sales as the label value. The measure is aggregated to SUM by default and applied to both sections.

Select SUM(ZeroCal) from the Marks card shelf and drag and drop the Category dimension to the colors shelf. And you can see the Categories on the first axis. However, if you observe the Donut Chart sheet, it shows the sum of sales in the second axis. So, we need to work a bit to show it in the second section.

Converting the Pie chart into a Tableau Donut Chart involves the dual axis. Selecting and right-clicking the second measure (SUM(ZeroCal)(2)) on the Rows shelf or the Axis will open the context menu. Clicking on the dual axis will do the trick for you. Here, we right-clicked the second Calculation and selected the Dual Axis option.

We have converted these two pie plots into a donut chart. Next, select the second SUM(ZeroCal) from the marks shelf and increase the scroll size to increase the outer circle of the donut.

Now, you can see the actual donut chart. But first, let me change the color of the middle area by increasing the opacity to 100% and selecting the Color White to improve your experience.

Right-click on the Left and Right side of the Axis and uncheck the Show Header option to remove the Axis. Next, use the Format Menu to remove the Zero, Grid Lines, and Axis lines from the report.

The final output of the Tableau Donut Chart is as follows. Here, we selected and dragged each sales value into the region.
The below image shows the actual sales value, but you can also display the percentages in the Donut chart. To do so, click the down arrow beside the SUM(Sales) -> Quick Table Calculation -> Percent of Total.

The desktop will instantly display the percentages on the Donut Chart for you.

Tableau Donut Chart using Maps MAKEPOINT
The other option is using the MAKEPOINT function and maps. This section shows how to create a Donut chart using the MAKEPOINT function of 0, 0 coordinates and Maps.
Step 1 – Create a Calculated Field of MAKEPOINT: Right-click the Empty space and choose the Create Calculated Field.. option. It will open the following window to write the calculation. Let me add a unique name and add MAKEPOINT(0, 0) as the value.
Name: MakePoint

Expression: MAKEPOINT(0, 0)
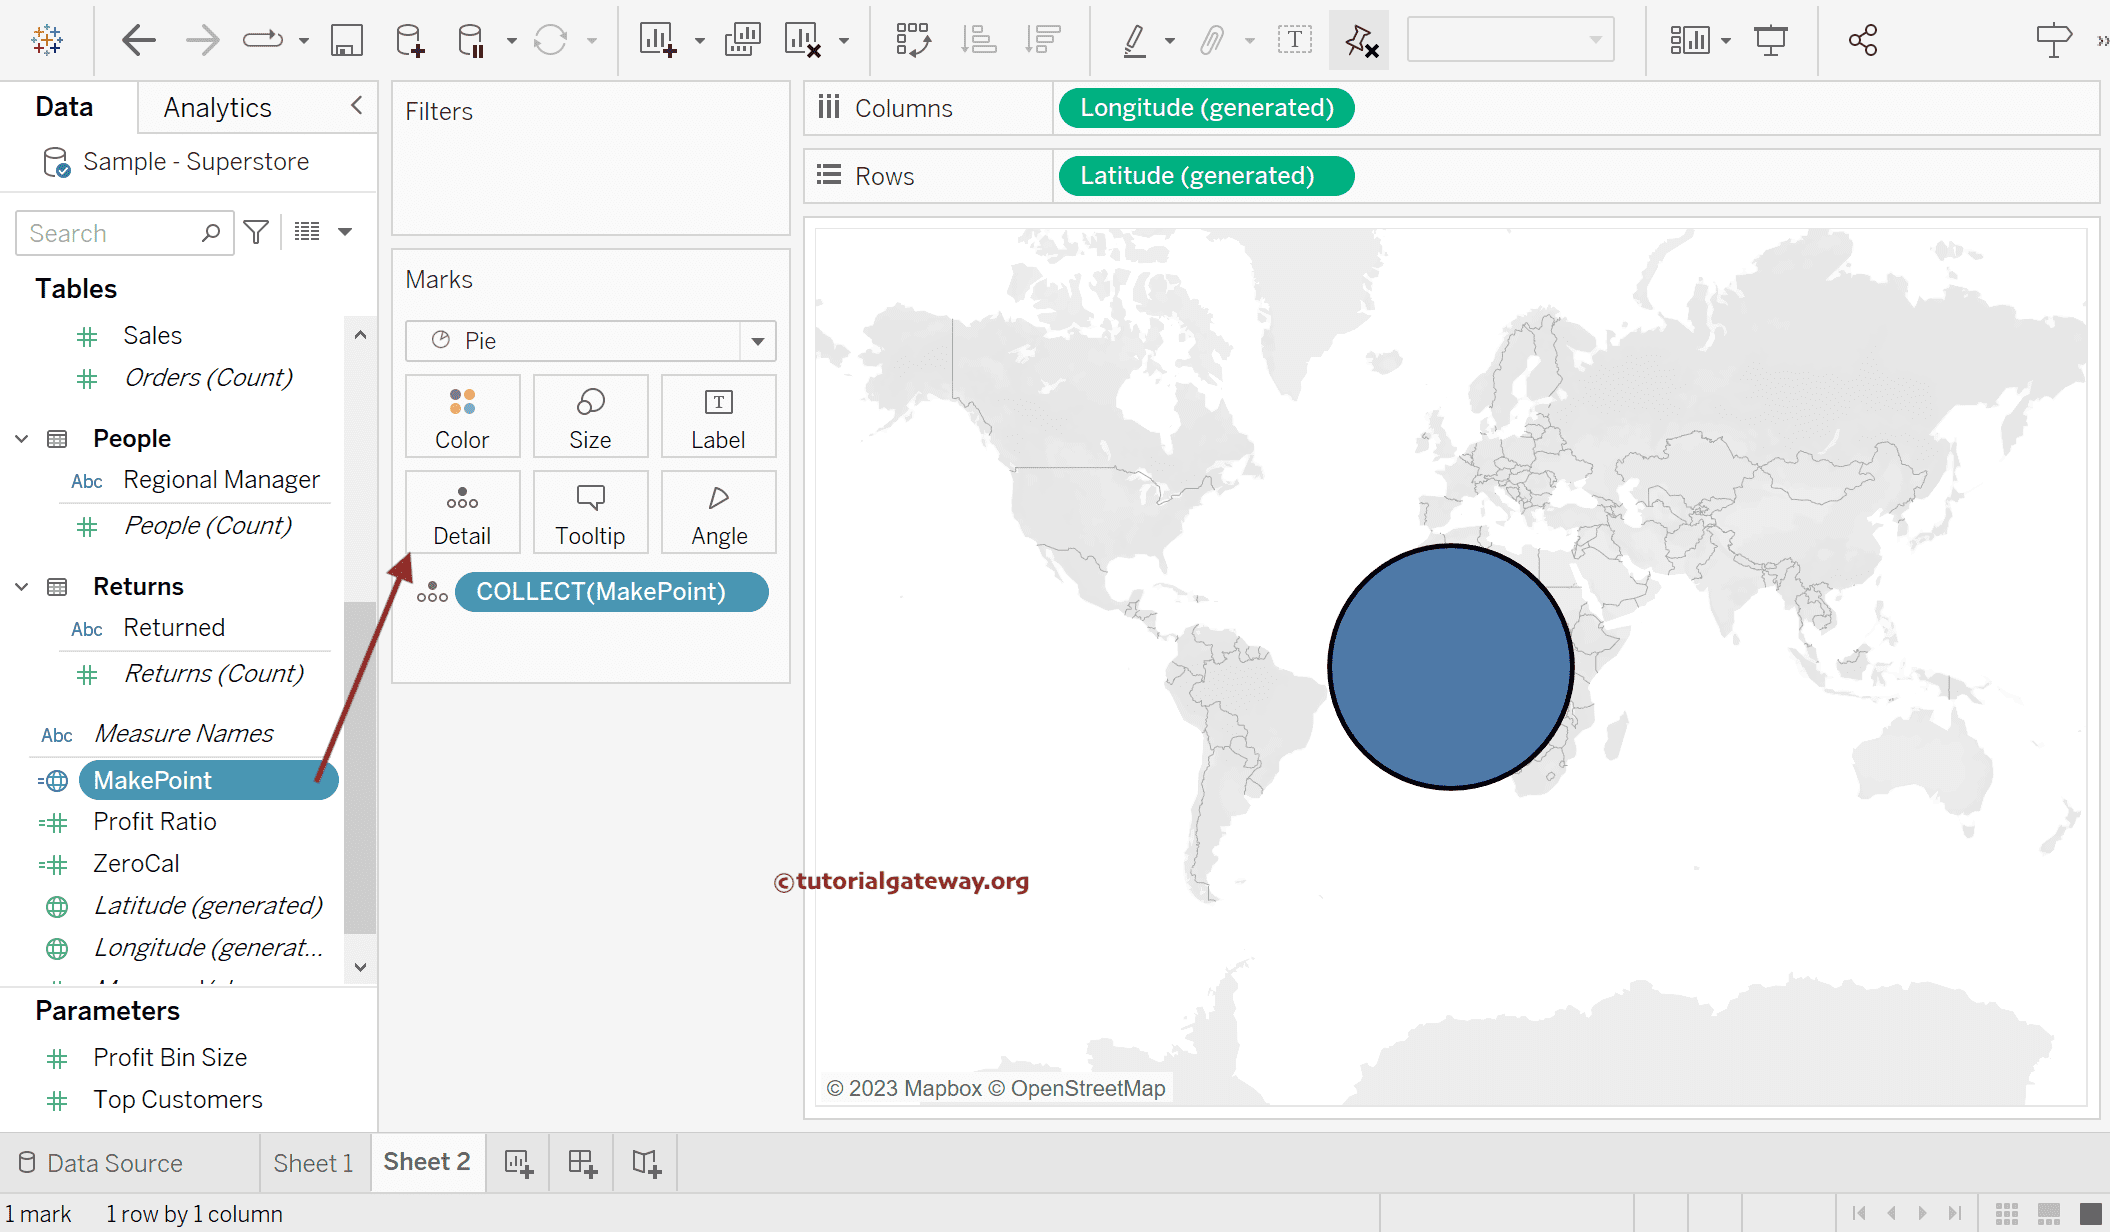
Step 2 – Add MAKEPOINT to the Details Shelf: Double-click on the MAKEPOINT calculated field or add it to the Details shelf to create a Map with auto-generated Latitude and Longitude. Use Control + Shift + b to increase the size of a circle.
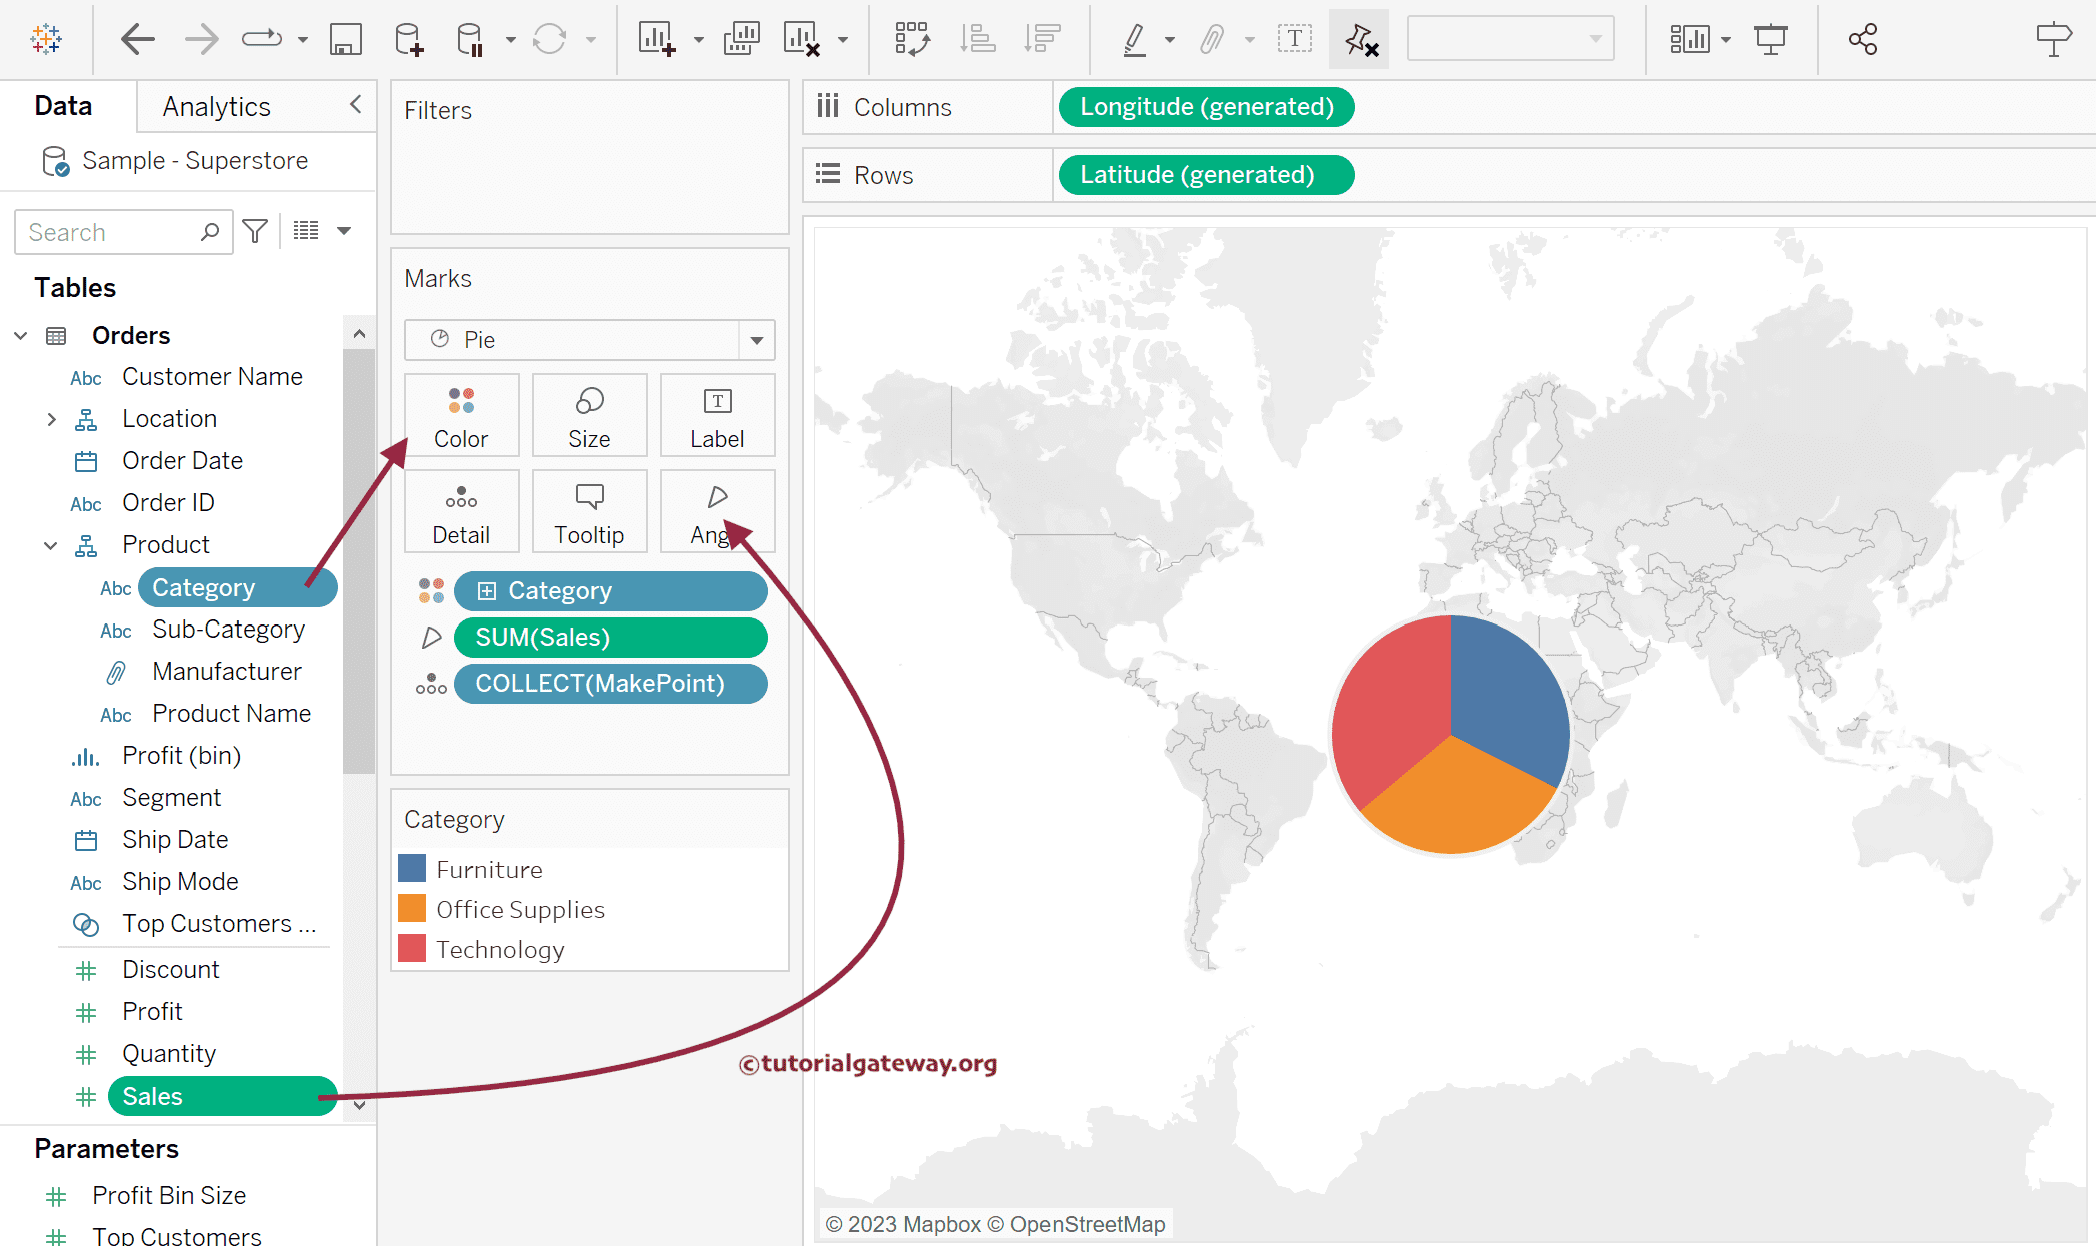
3rd Step – Change the Marks Type to Pie: Please change the Marks type from Automatic to Pie Chart. Next, add the Category Dimension to the Color Shelf and Sales Measure to the Angle Shelf.
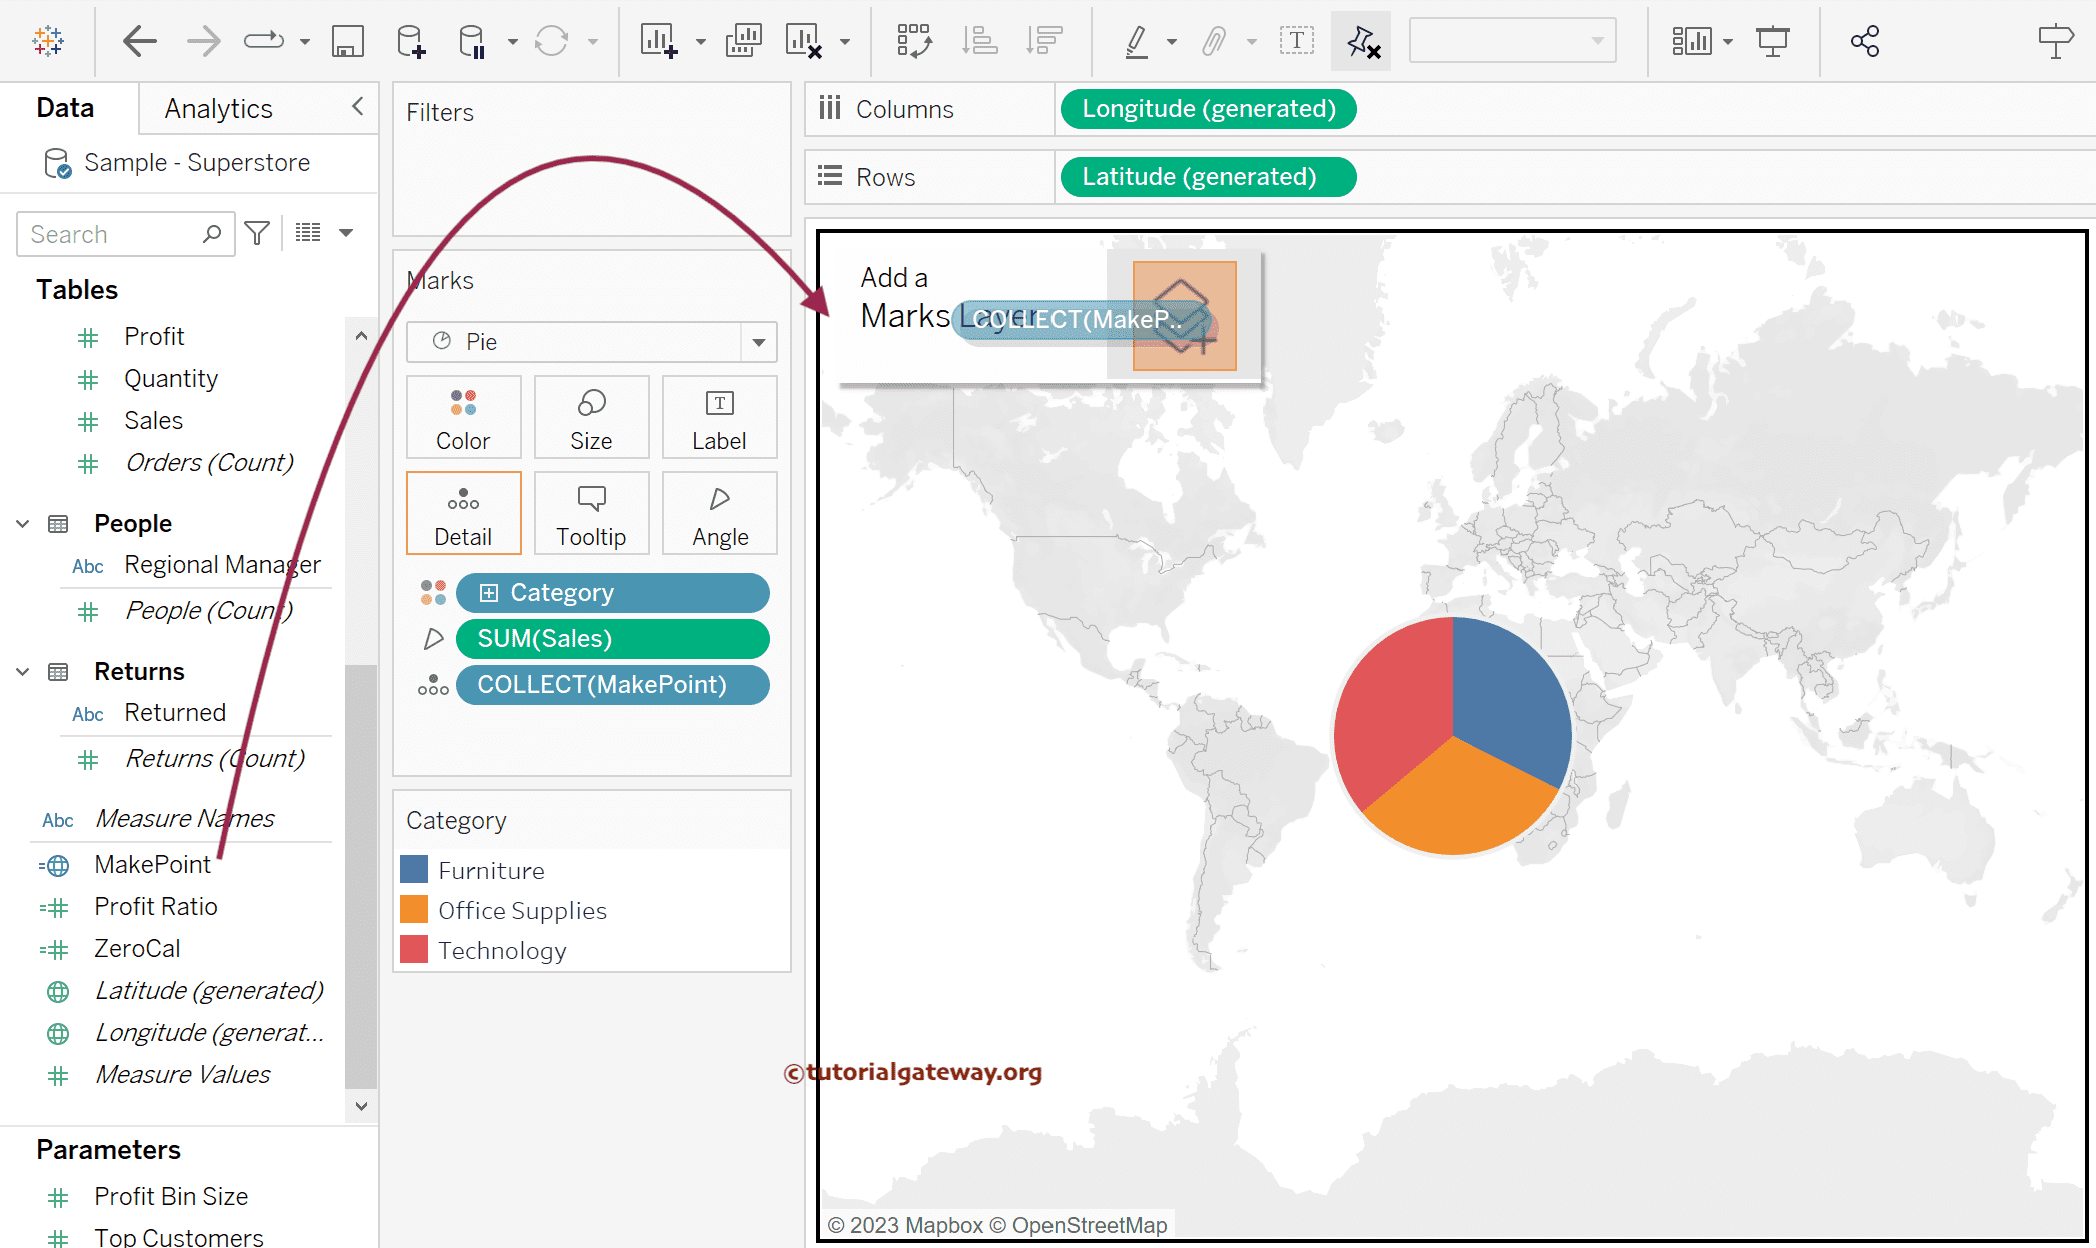
Step 4 – Add Collection to Create a Donut Chart: We need an inner circle to create a donut chart. For this, drag and drop the MAKEPOINT field to the Marks Layer to create another collection of Pie.
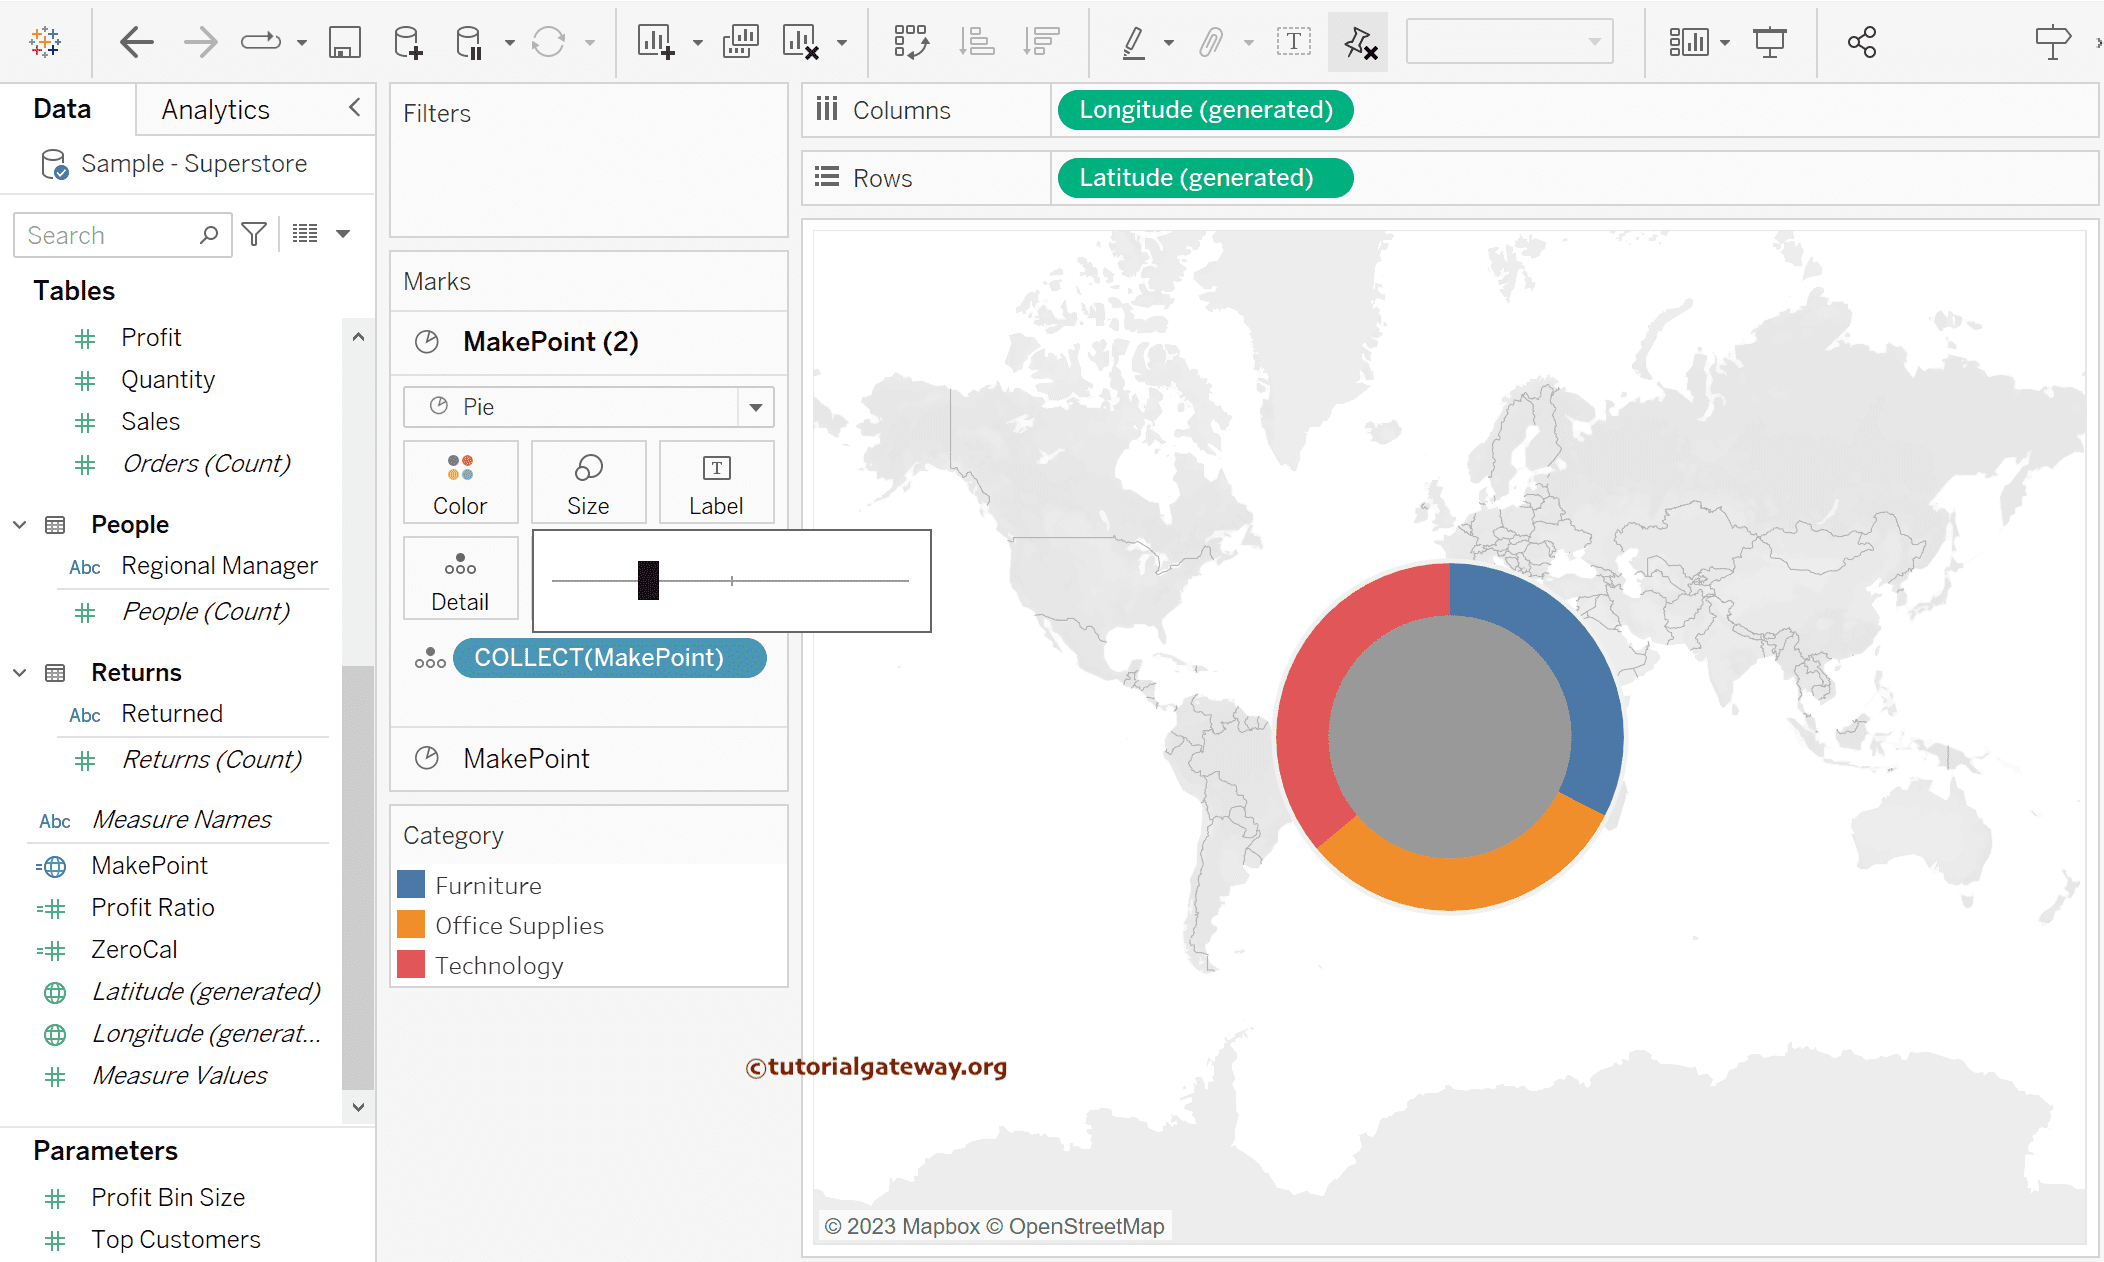
Increase Tableau Donut Chart Size
You will see the small grey circle in the middle of the Pie chart. Use the Size shelf of the MakePoint(2)to increase the inner circle size.
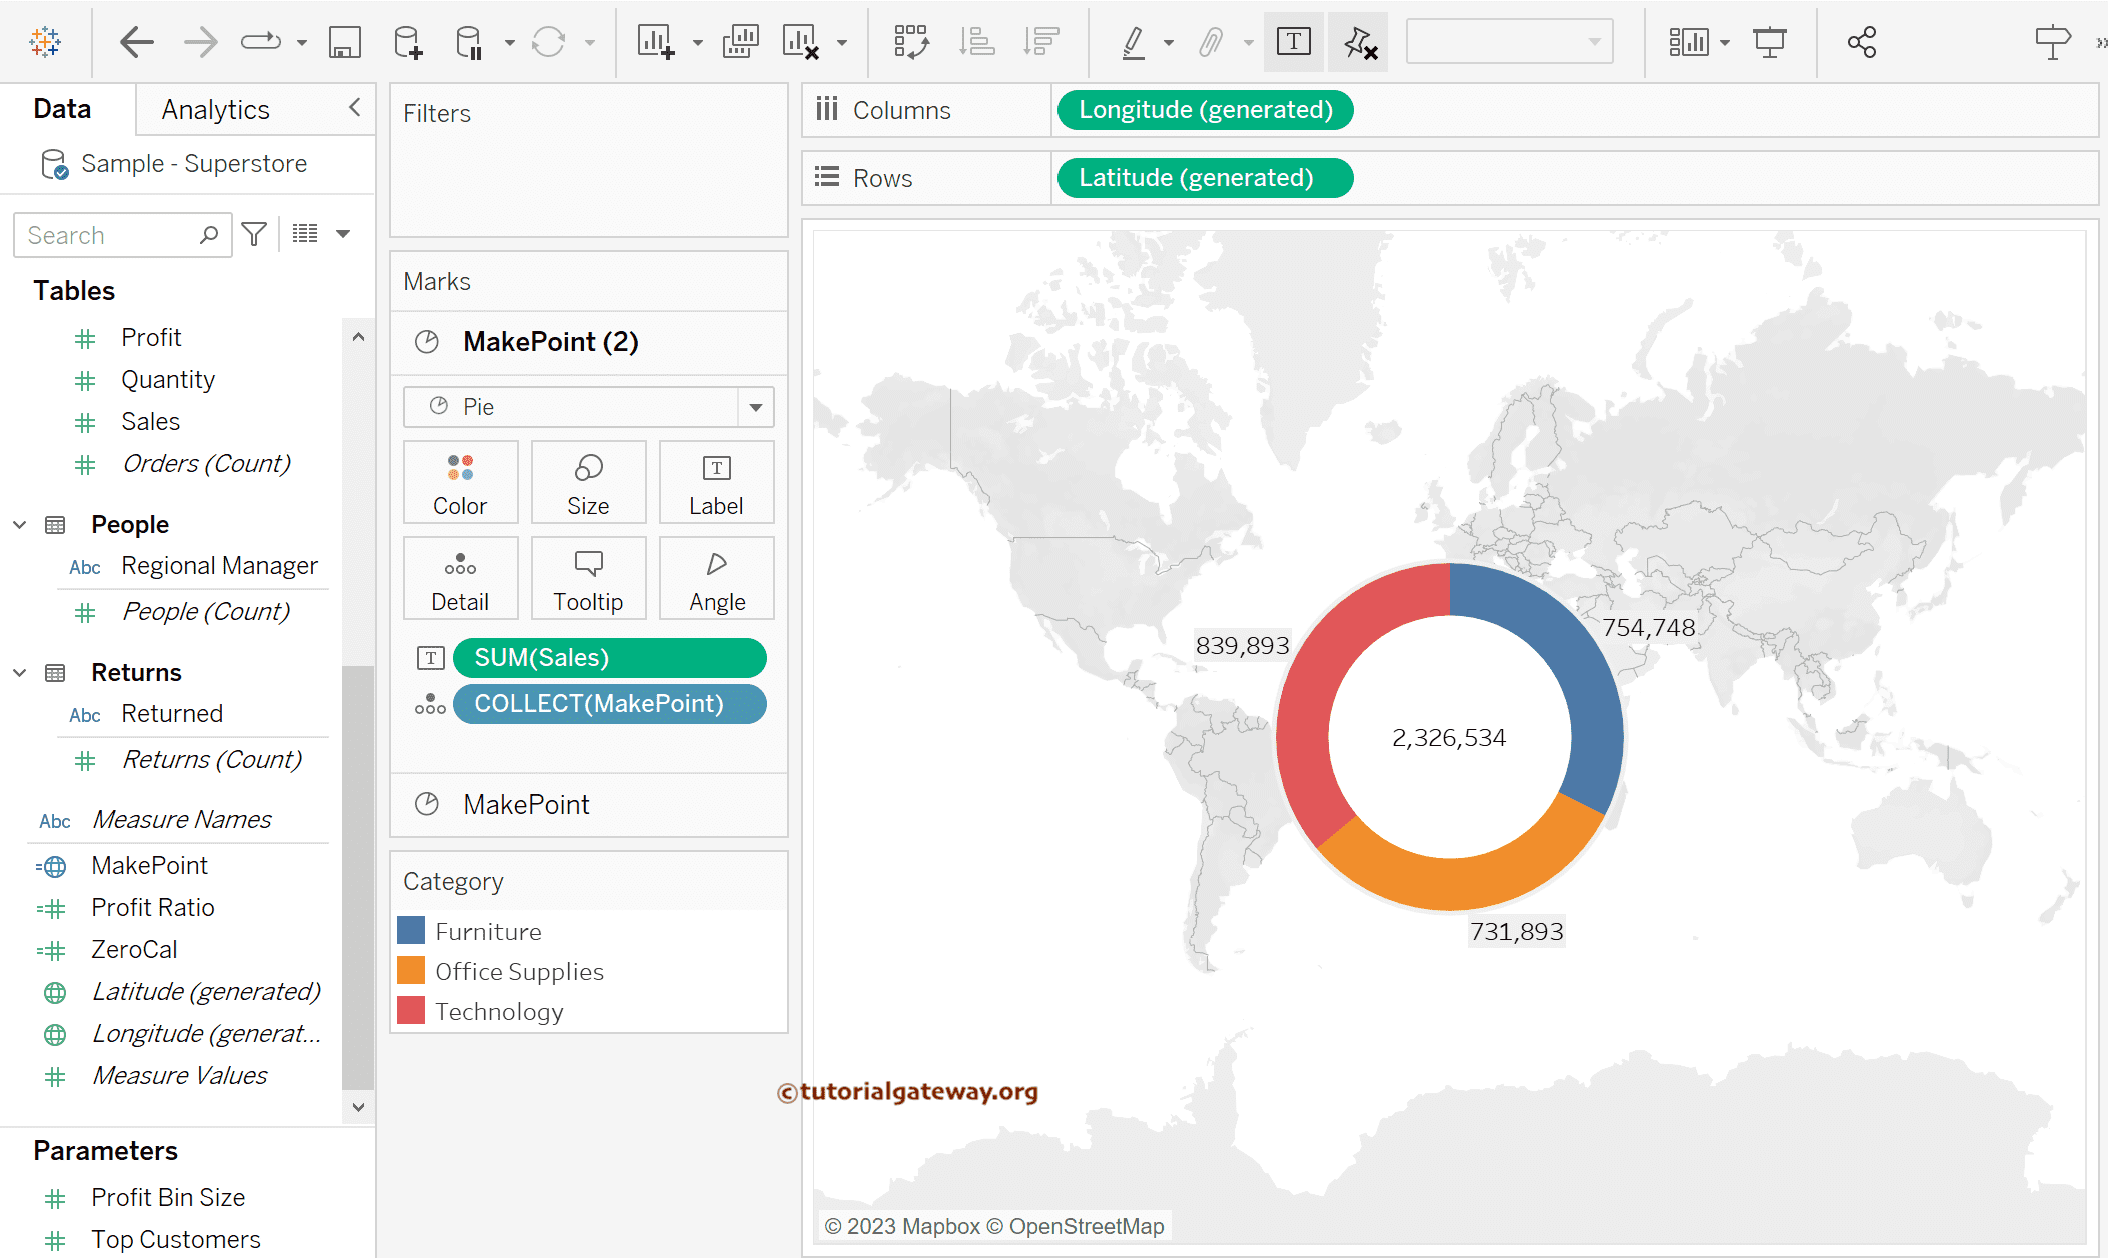
Add Data Labels to the Tableau Donut Chart
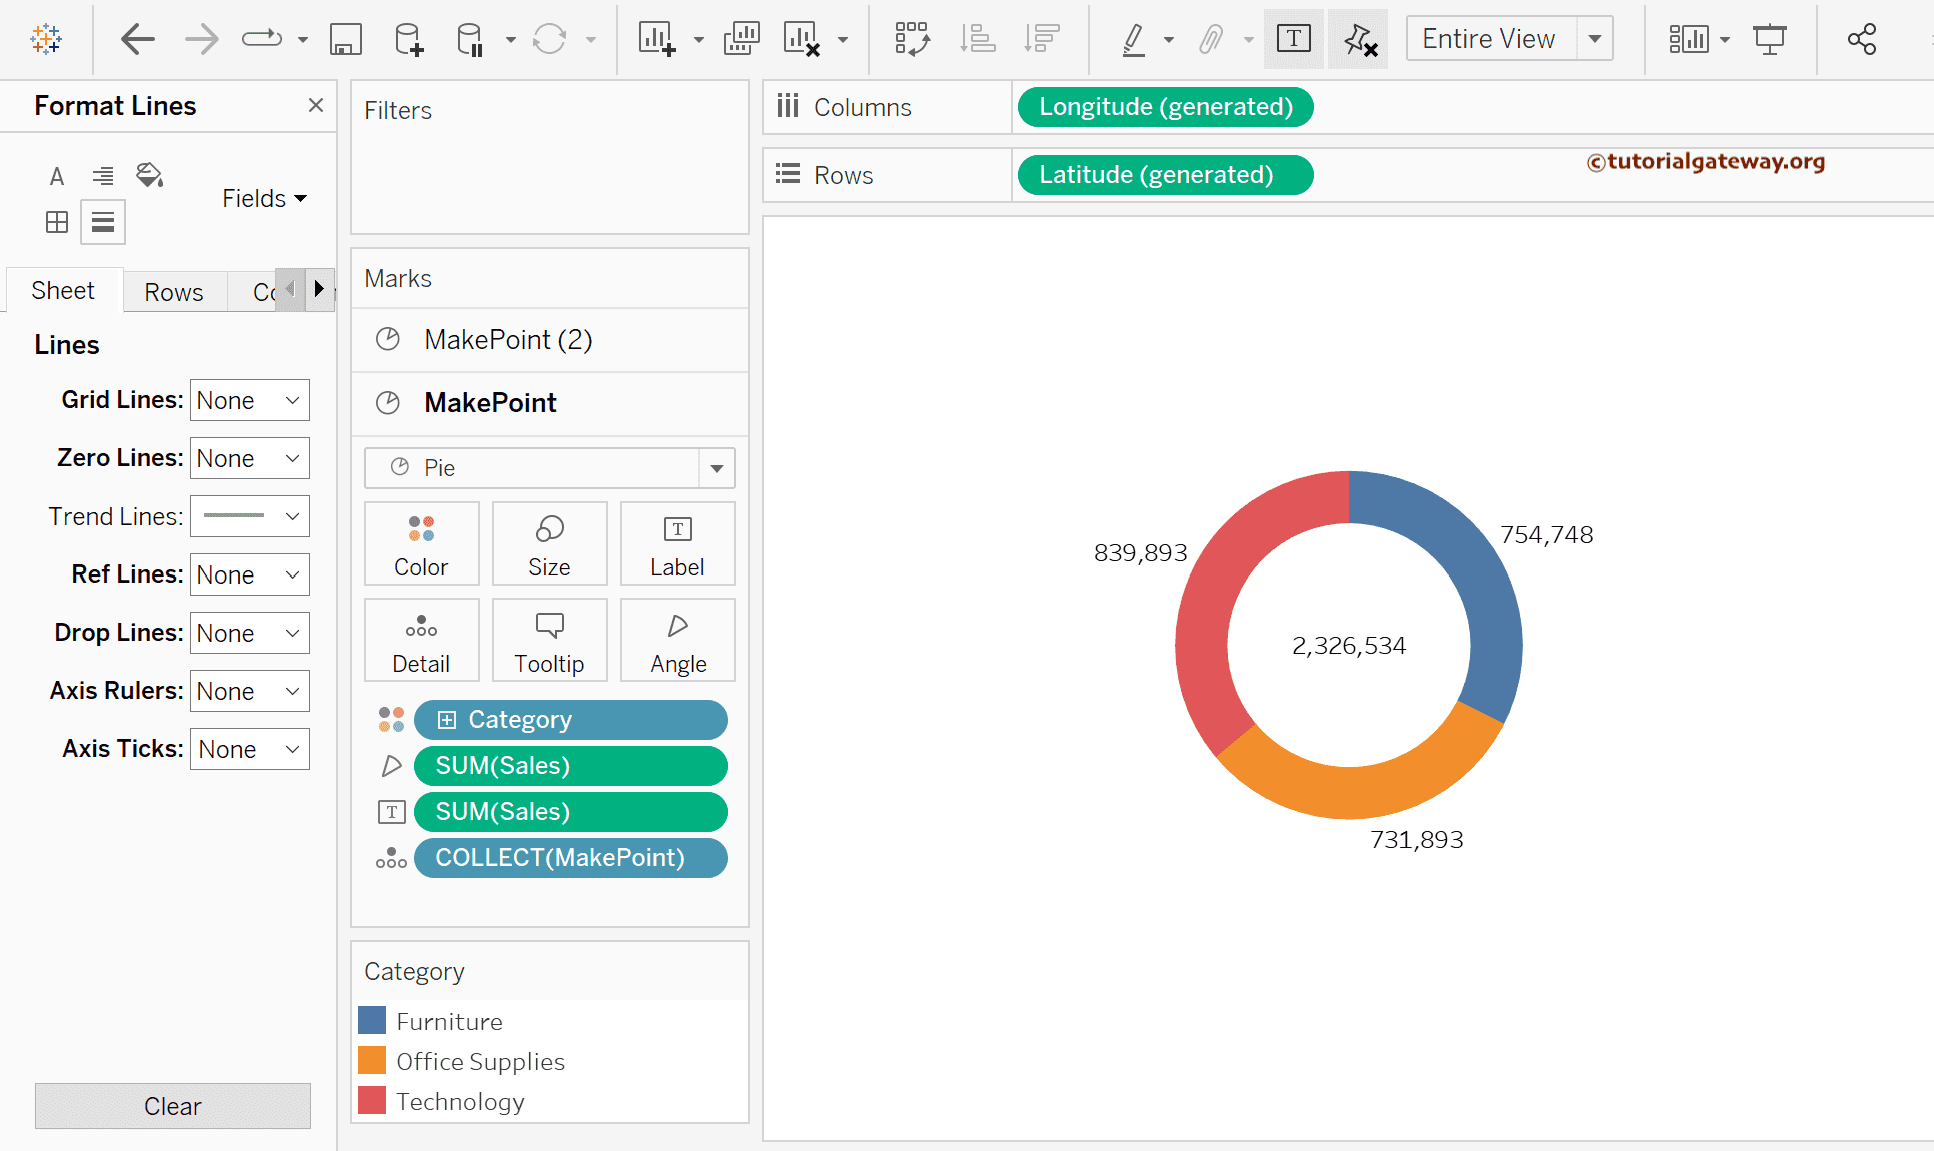
Drag and drop the Sales Measure to the Labels shelf of both the MakePoint and MakePoint(2) marks. The first one helps to add data labels to the outer circle category, and the second one adds the total sales to the inner circle.
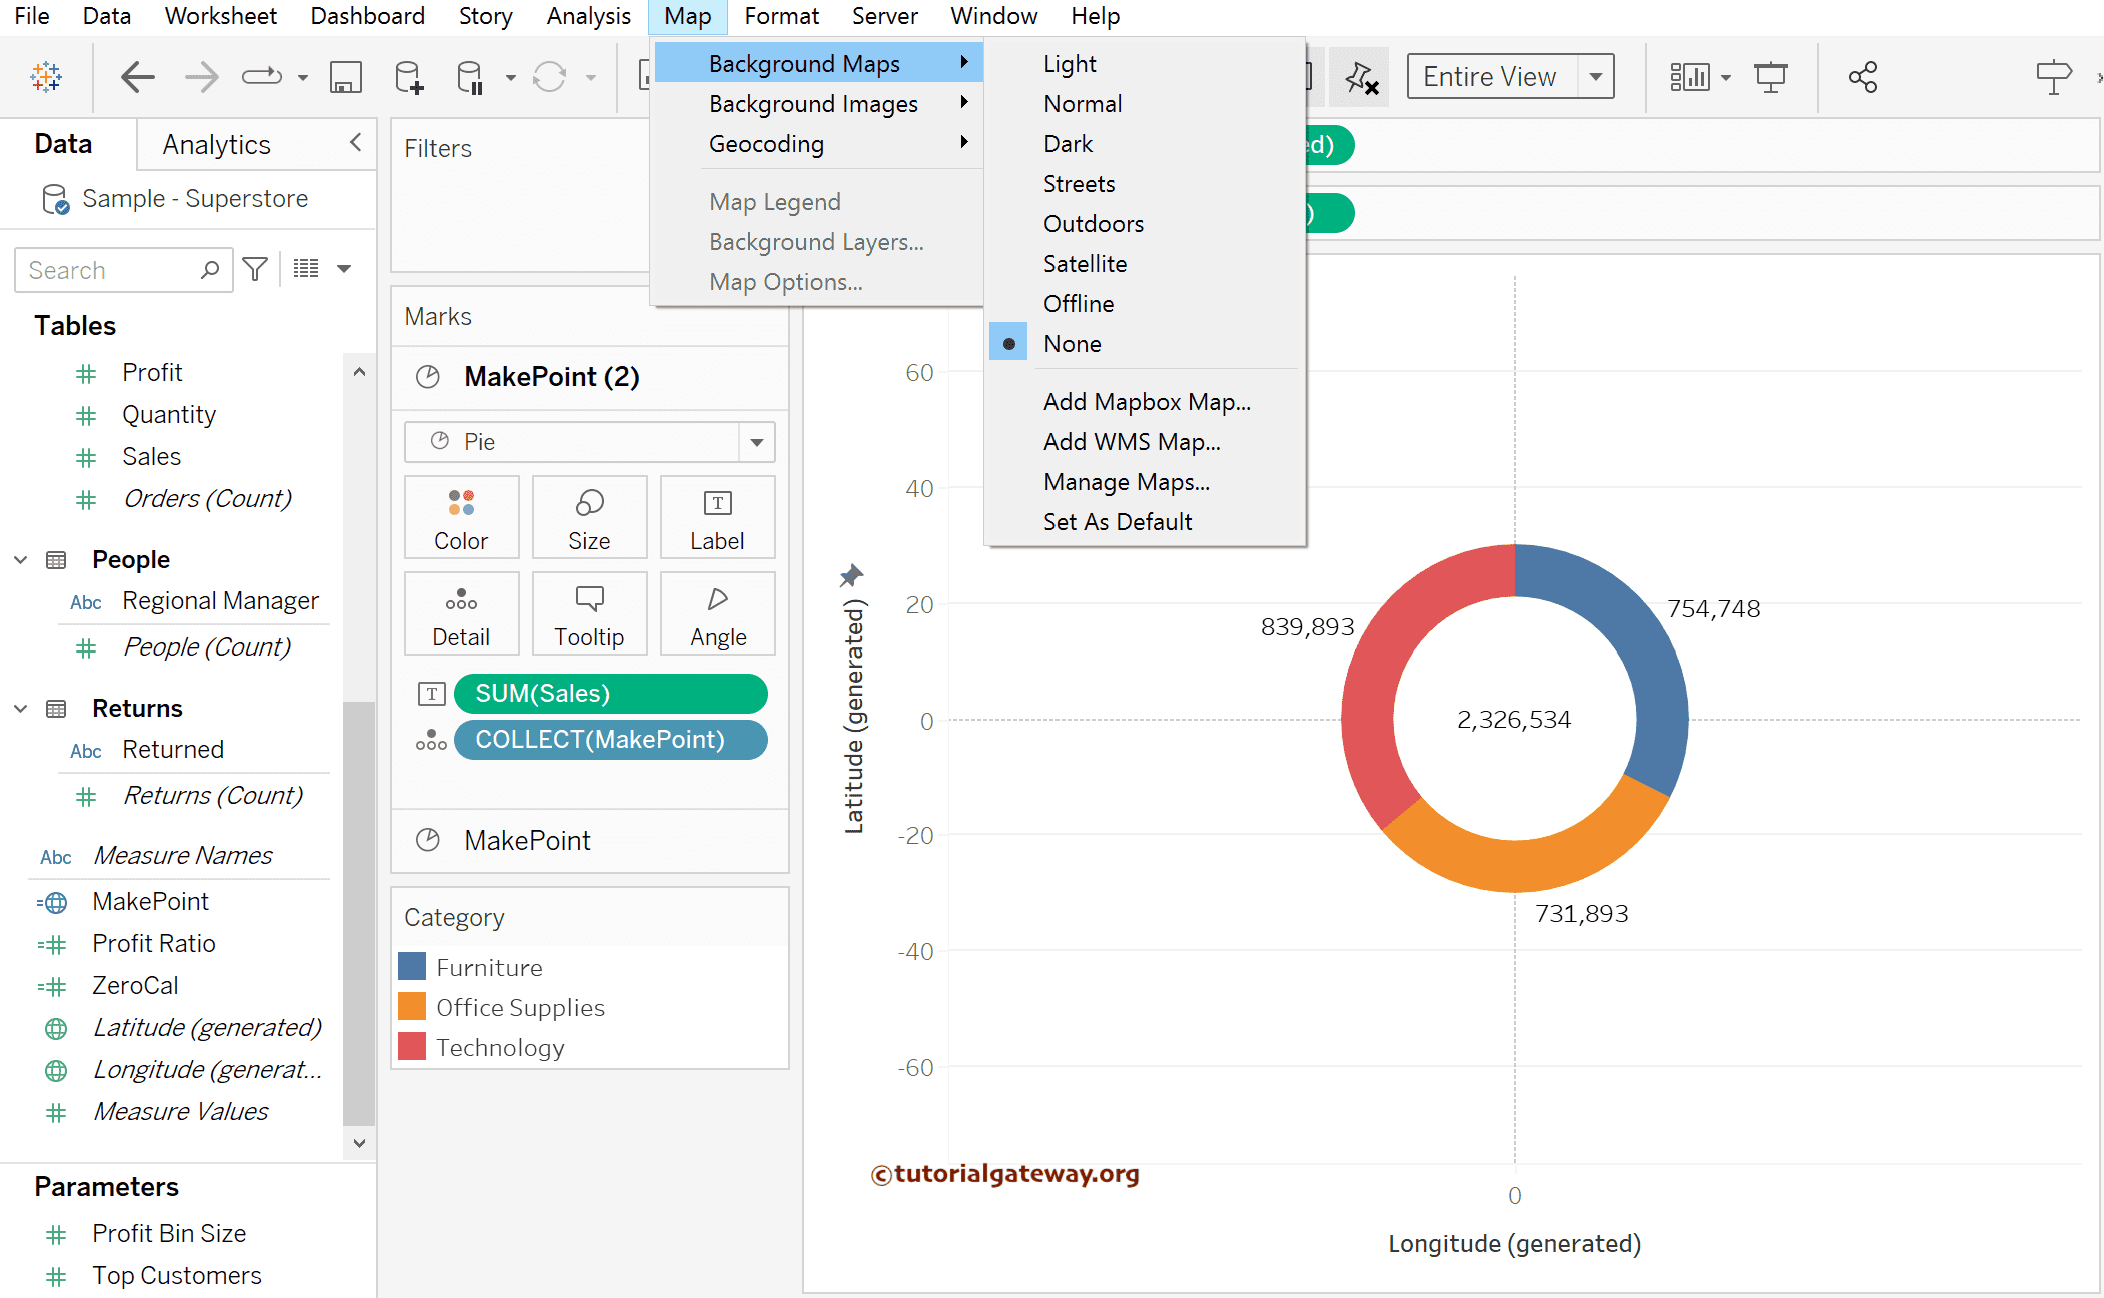
Format: Remove Background Map
If you observe the above Tableau image, although it looks like a Donut chart, the background map doesn’t allow you to focus on the Donut. So, let me remove it using the Map menu. To do so, go to the Maps Menu, select the Background Maps option, and click the None option.
Format: Remove Grid and Axis Lines
The next step is to remove the Latitude and Longitude lines and the Gridlines. Use the Format Menu to format the fonts and remove the Zero Lines, Grid Lines, and Axis Ticks from the Tableau Donut Chart.