This article shows how to calculate the moving average in Tableau with an example. To demonstrate this moving average calculation, we use a simple table report and a line chart that makes you understand it better.
To demonstrate the Tableau moving average calculation, drag and drop the English Country Name to the Columns shelf and Color to the Rows shelf. Next, pull the Sales amount to the Text shelf. Next, add the row and column grand totals and format them. Please visit the SQL Source and SQL Tutorial articles to understand the Data Source.
Steps to calculate the moving average in Tableau
Under the Marks shelf, click the down arrow beside the Sum(SalesAmount), click Quick Table Calculation, and then select Moving Average. For the remaining charts in Tableau, please visit the Tableau Charts article.

Now, it displays the moving average calculated across the Table. It means average for Black Color. Please refer to the Row and Column Totals article for row and column totals.
- Australia and Canada = ( 2930604 + 536389) / 2 = 1,733,496.5
- France = (2930604 + 536389 + 894507) / 3 = 1,453,833.33

Let me change the computing using the option from Table (across) to Table(Down). Then, Tableau calculates the moving average for each country (not Color), i.e., Table Down.

Without Quick Table Calculation
This Tableau section shows the steps to calculate the moving average on Matrix or crosstab without using the Quick Table Calculation. It’s a simple matrix with Year of Order Date on the Columns shelf, Quarter(OrderDate), and Month(OrderDate) on the Rows shelf.
Next, add Year(OrderDate) to the Color and Sales to the text section. Then, drag Order. Date to filter shelf to remove 2010 and 2014 years. Click the down arrow beside the Sum(SalesAmount) and select the Add Table Calculation option.

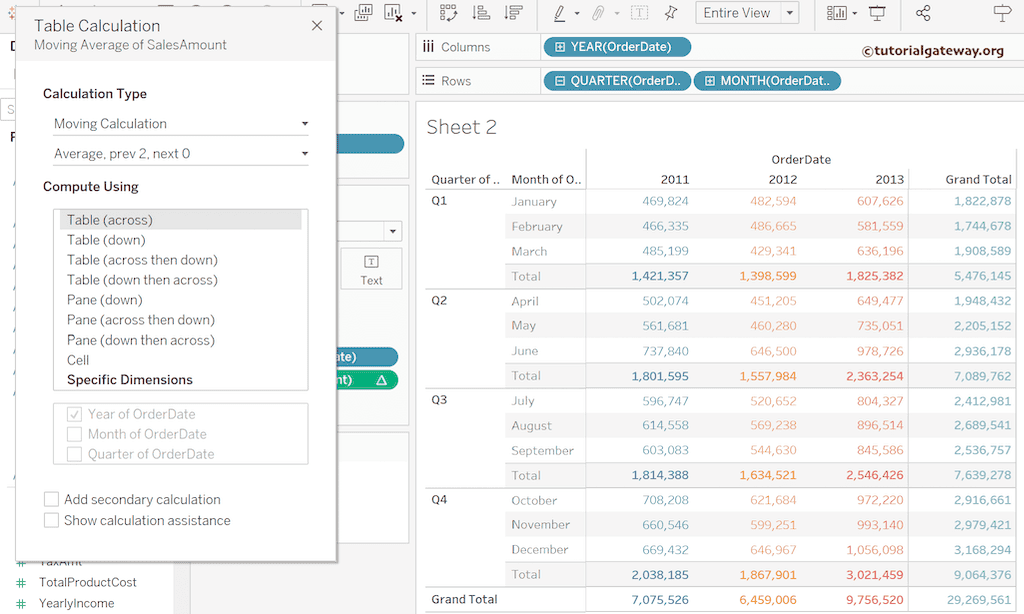
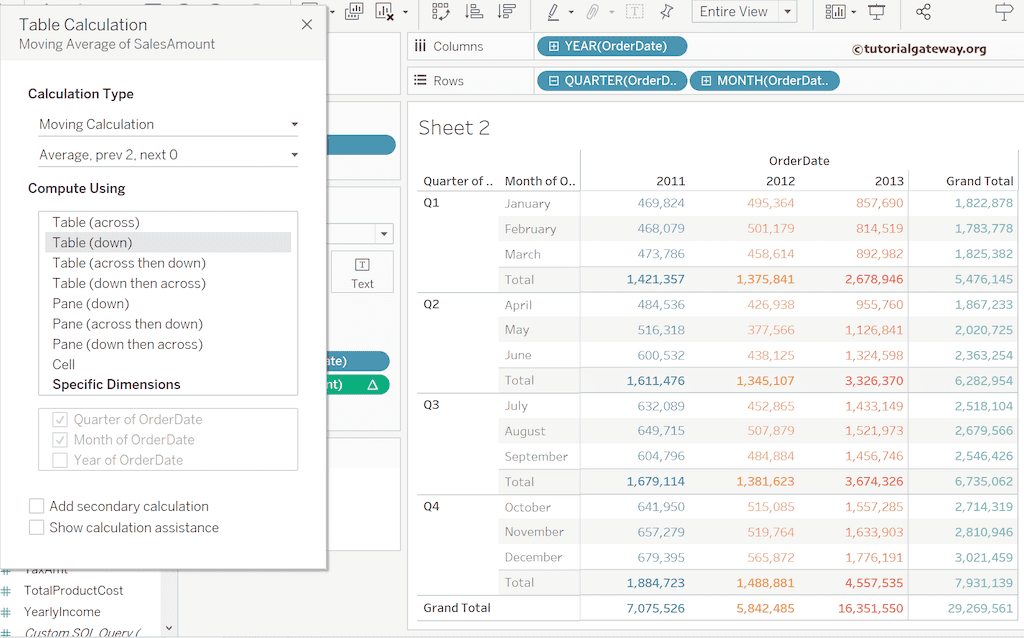
First, change the Default Calculation type from the Difference From option to Moving Calculation. Next, change the Summarized Value using the default Sum to Average option.
Compute using Table (down): Tableau calculates the moving average for each year (2011, 2012, and 2013).
Compute using Table (across then down): It calculates the moving average for each month (Jan 2011, Jan 2012, Jan 2013, Feb 2011, etc.).

Specific Dimensions: Choose the dimensions to calculate the moving average.

Calculate the Moving Average of a Tableau Line Chart
Drag and drop the Sales Measure to the Rows shelf twice to demonstrate this example and add the OrderDate date field to the Columns Shelf. Next, click the down arrow beside the YEAR(OrderDate) and choose the Week (instead of Year). By default, it creates two line charts for the Sales and the Week of Order Date.
Our job is to see the weekly actual sales against the moving average. So, click the down arrow beside the second SUM(SalesAmount), choose the Quick Table Calculation, and then select the Moving Average option.
To understand the steps, you should refer to the Quick Table Calculation, Line Chart, and Dual Axis articles.

Next, click the down arrow beside the SUM(SalesAmount) table calculation and choose the Dual Axis. Then, right-click the Moving Average of SalesAmount axis and choose the Synchronize the Axis option. Next, uncheck the Show Header option to remove Axis values.

Tableau’s moving average calculation uses the previous two as the reference point by default. However, you can change it as per the company’s requirements. To do so, click the down arrow beside the SUM(SalesAmount) table calculation and choose the Edit Quick Table Calculation option. As you can see from the screenshot below, we decided on the previous three values and the following values: 1. If you look at the chart, it shows four nulls.

Similarly, if I choose the previous 2 and the next 5, it shows seven nulls. You can notice the line chart’s start and end positions of the moving average table calculation.
