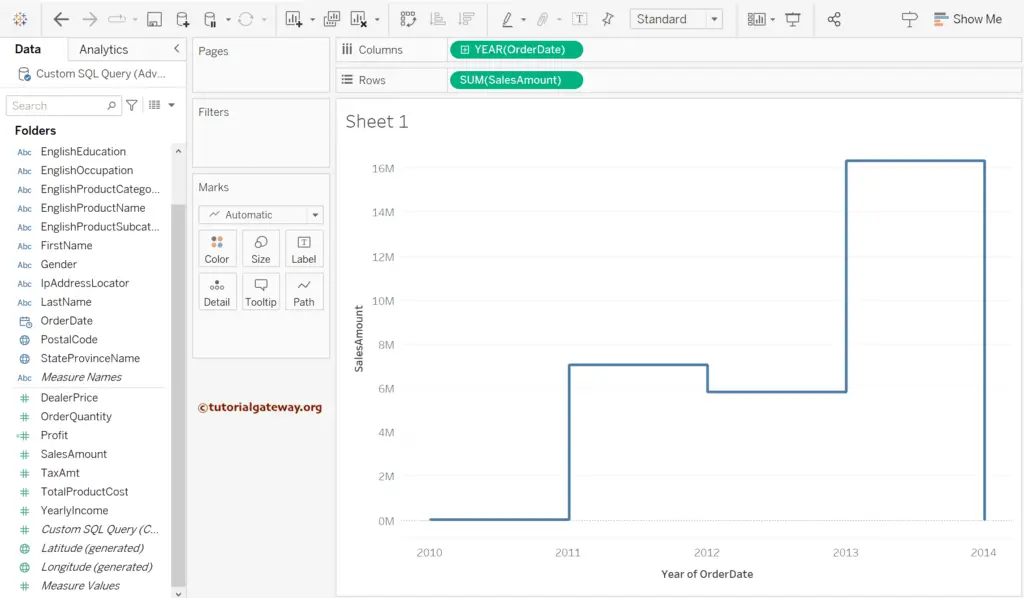
This article will show you how to create a Tableau Stepped Line Chart with an example. Instead of continuous lines, steps show the sales increment and downfall in a boxy manner.
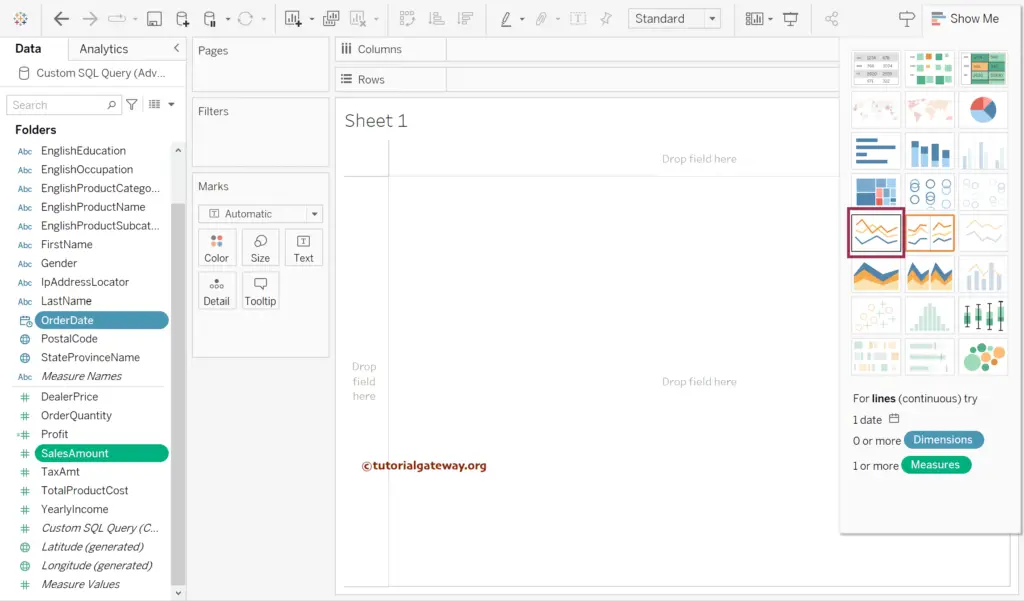
First, select the Order Date and the Sales Amount and click on the show me window continuous lines chart to generate a regular line chart.
Now, you can see the standard line chart.
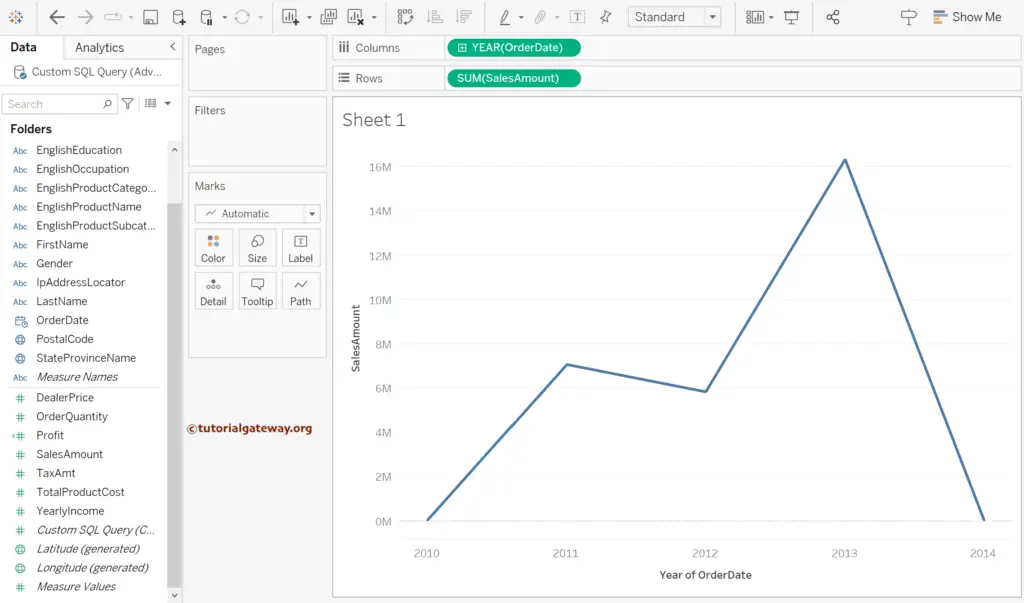
Tableau Stepped Line Chart Example
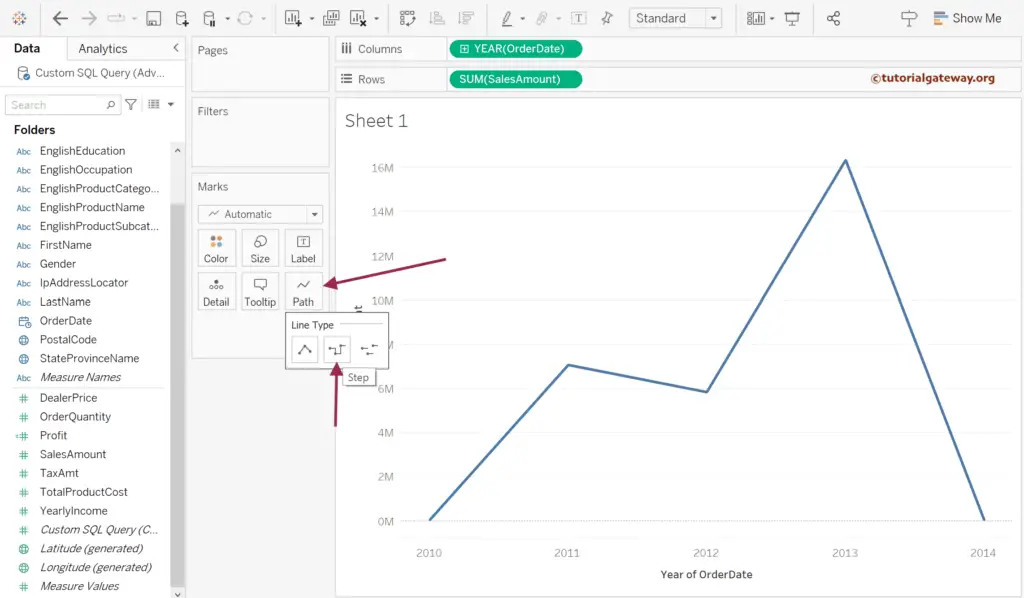
Click the Path section to choose the Line Type within the Marks Shelf. Next, select the Step (middle one) to change the normal to a stepped line chart.
From the below image, you can see the stepped line chart.
Let me select the Quarter of the Order Date to quarterly sales.
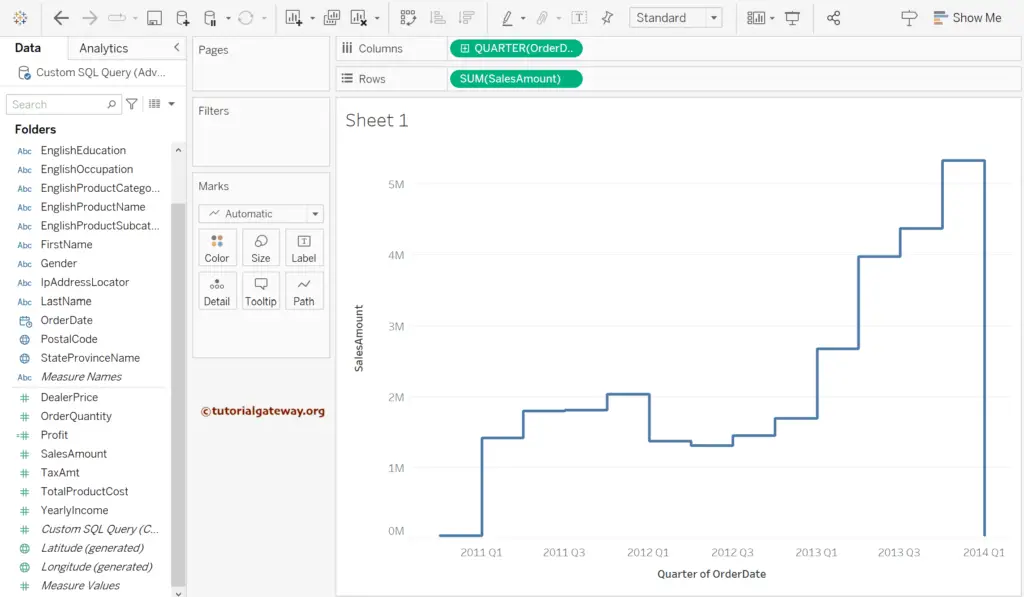
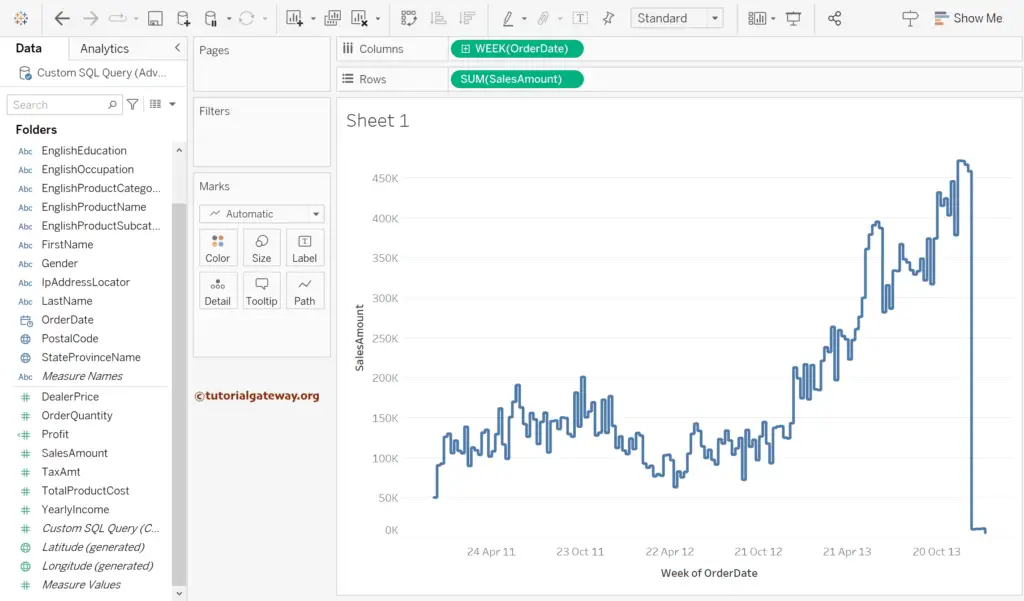
Select Week using the down arrow to see the weekly sales within the Columns shelf.
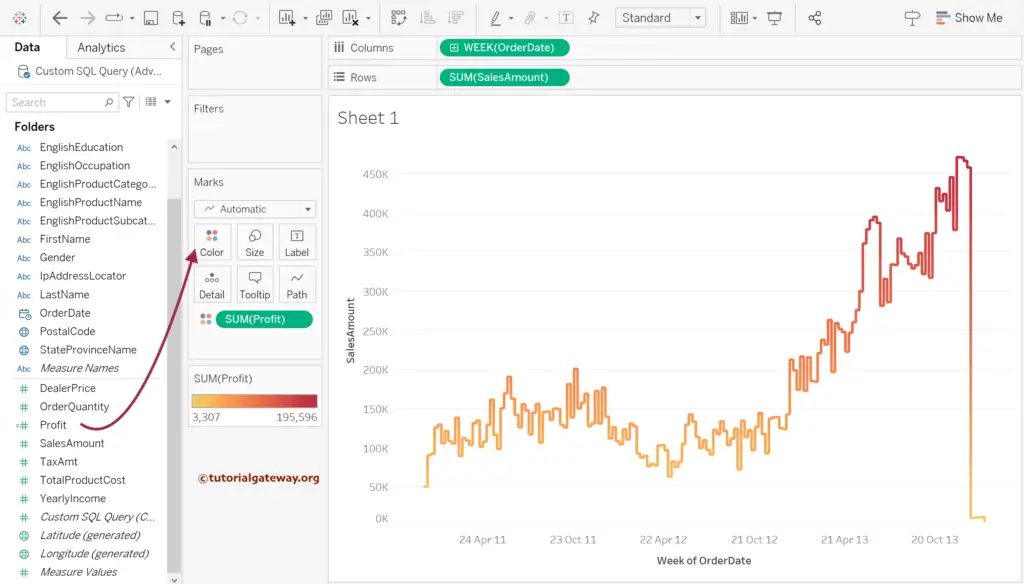
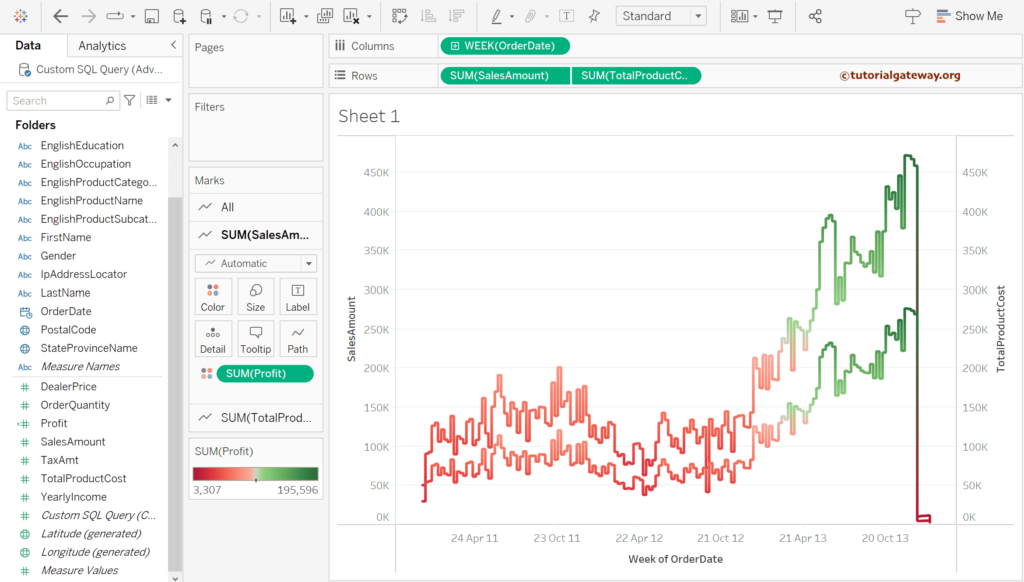
Drag and drop the Profit measure field to the Color shelf to change the color of the stepped lines based on the profit.
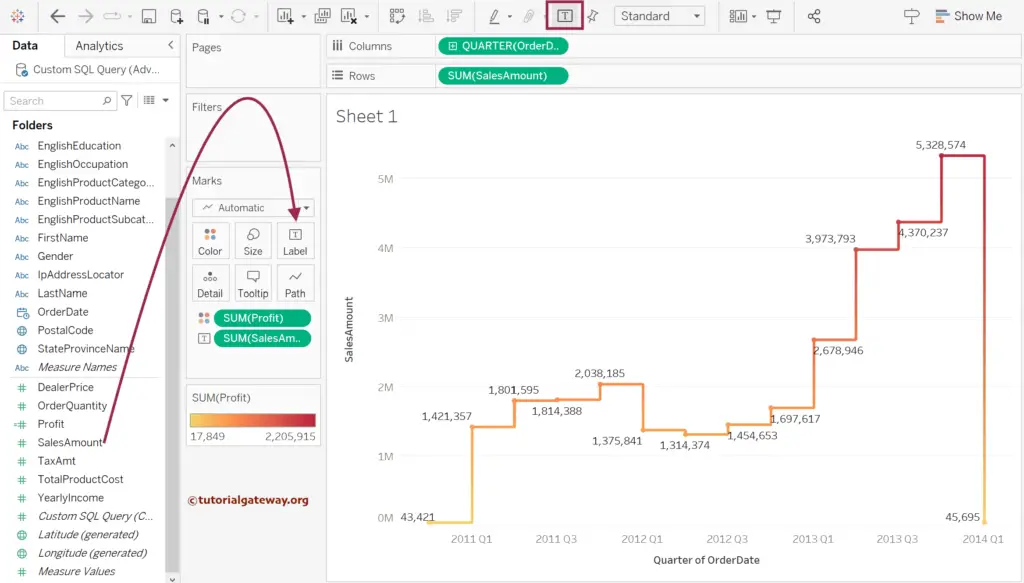
Add the Sales Amount to the label shelf or click the T button to show the data labels to the Tableau stepped line chart.
Let me add one more measure, i.e., Total Product Sale, to the rows shelf and perform Dual Axis and Synchronize the Axis to show the stepped line chart for multiple measures.
Also, refer to the Change the Line Chart Color and Change the Size of a Line Chart articles to understand the options.
