This article shows you how to create a Tableau Discrete Line Chart with an example. A line chart generally displays data in a continuous line, but a discrete line chart will further divide them into multiple sections to compare them.
We need one date field and at least one or more measures to create these discrete line charts in Tableau. So, select the Order Date and the Quantity Measure and click on the discrete lines option from the Show Me window to generate a chart.

It looks like a regular line chart.

How to Create a Tableau Discrete Line Chart?
Expand the Date hierarchy within the columns shelf by clicking the plus button beside the Year. Now, you can see the discrete line chart that displays the quantity by year on end and the Quarter on the other end of the axis.

You can further expand the date hierarchy to view Yearly, Quarterly, and Monthly Quantities.
First, click the Minus button beside the Quarter to remove the month from the Columns shelf. Next, drag and drop the Segment field to the Color shelf to add colors to the discrete lines chart.

Click the T button or add the Quantity Measure to the Label Shelf to add data labels to the Tableau discrete line chart.

Discrete Line Chart Using Multiple Measures
Use Control or Command to select the Order Date Dimension, Sales, and Profit Measures. Next, click the image in the Show Me window, as shown in the first image, to generate two discrete line charts on two axes. You can see the lines on two axes in the screenshot below.

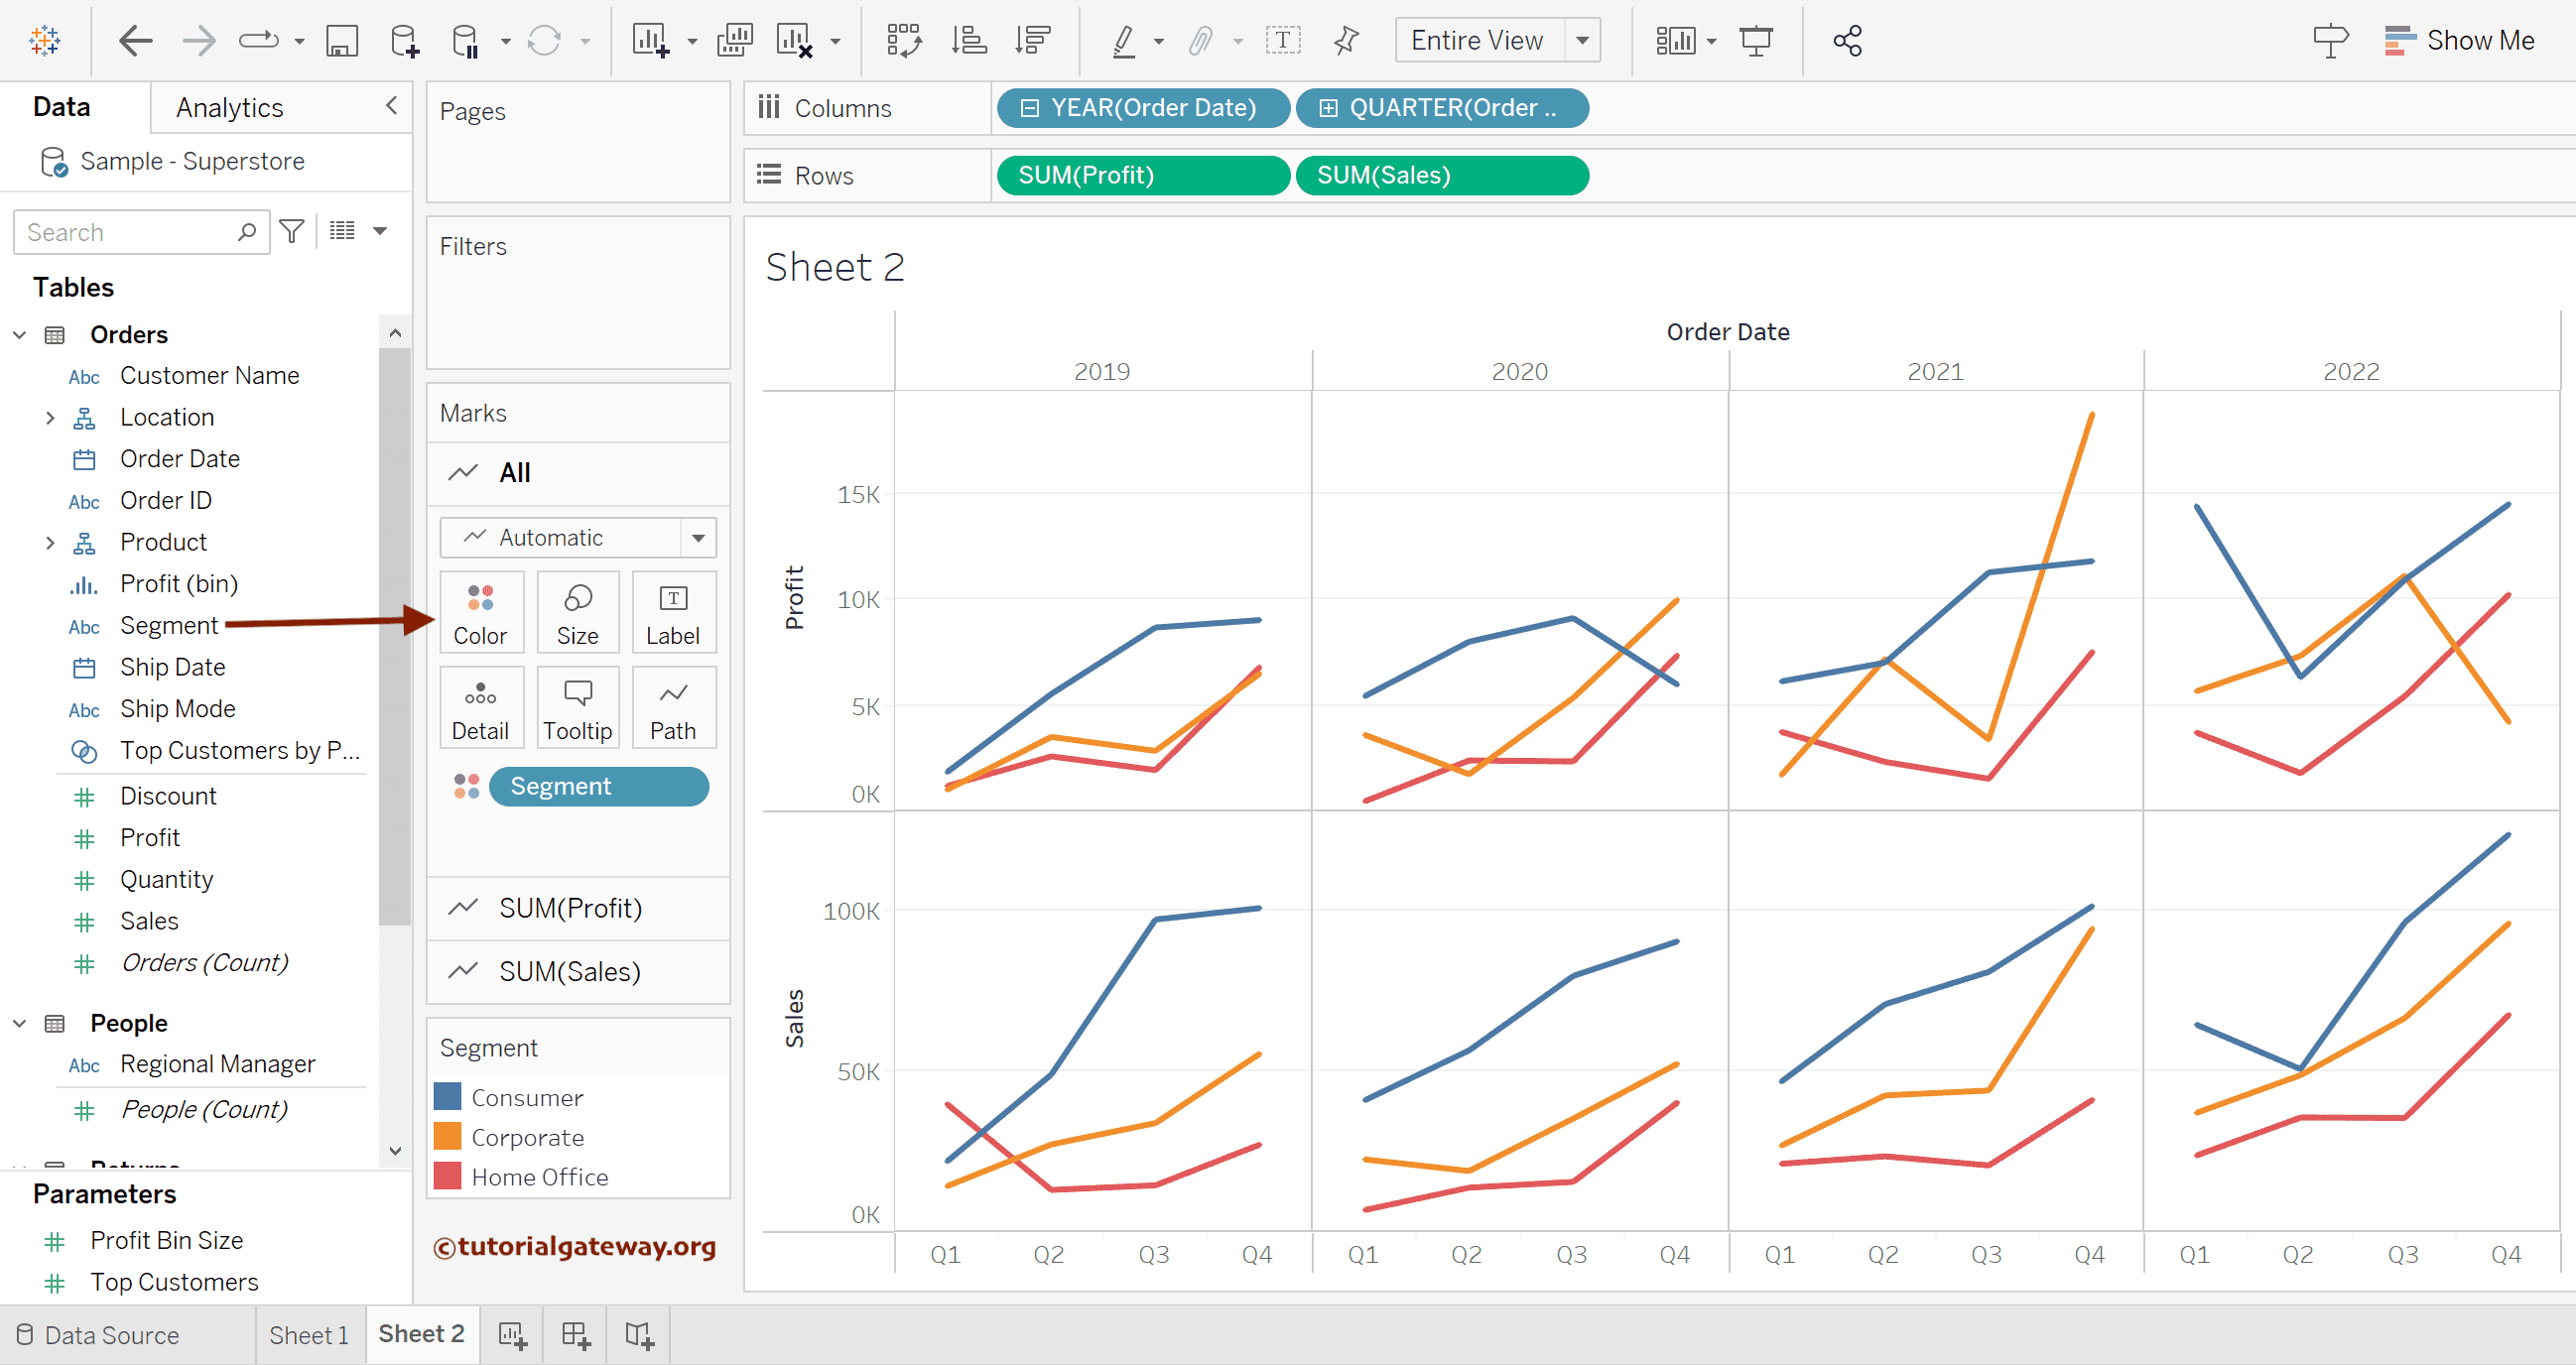
Let me expand the year to the Quarter level to see the discrete lines chart. Next, add the Segment field to the Color Shelf of All (profit and sales) to divide the discrete line chart further.
Please expand to Quarterly to see the discrete area chart for profit and sales in two axes.
Also, refer to the Change the Line Chart Color and Change the Size of a Line Chart sections to understand the options.