This Tableau article will show you how to pivot the table columns with an example. Unfortunately, there is no direct pivot option to achieve this goal in the desktop; however, we can write the custom SQL query to convert the unpivot data.
You can use the following T-SQL query to get the same table data from the Adventure Works database.
SELECT PROD.Name, YEAR(OrdHead.OrderDate) AS [Order Year],
       SUM(Details.OrderQty) AS [Order Quantity]
  FROM Sales.SalesOrderDetail AS Details
     INNER JOIN Production.Product AS PROD ON Details.ProductID = PROD.ProductID
     INNER JOIN  Sales.SalesOrderHeader AS OrdHead ON
         Details.SalesOrderID = OrdHead.SalesOrderID
GROUP BY   PROD.Name, YEAR(OrdHead.OrderDate)
ORDER BY [Order Year]
Please type the above query in the AW database to see the table data that we use in this example. Otherwise, find the preview in the SQL PIVOT article.
First, connect Tableau to the Microsoft SQL Server and drag and drop the table to see the data inside.
Next, go to the Data Menu and select the convert to custom SQL option.

Tableau Pivot Table Columns
We must write an SQL query using the PIVOT function to transform the Unpivot table columns data. Next, click the preview results option to view the pivot output.
SELECT Name,[2011], [2012], [2013], [2014]
FROM (
      SELECT [Name] ,[Order Year] ,[Order Quantity]
        FROM [dbo].[SQL Pivot Source] [SQL Pivot Source]
     ) AS SOURCE
PIVOT
   (
    SUM([Order Quantity]) FOR [Order Year]  IN ([2011], [2012], [2013], [2014])
   ) AS [Result]

Close all the windows to view the Table details and output.

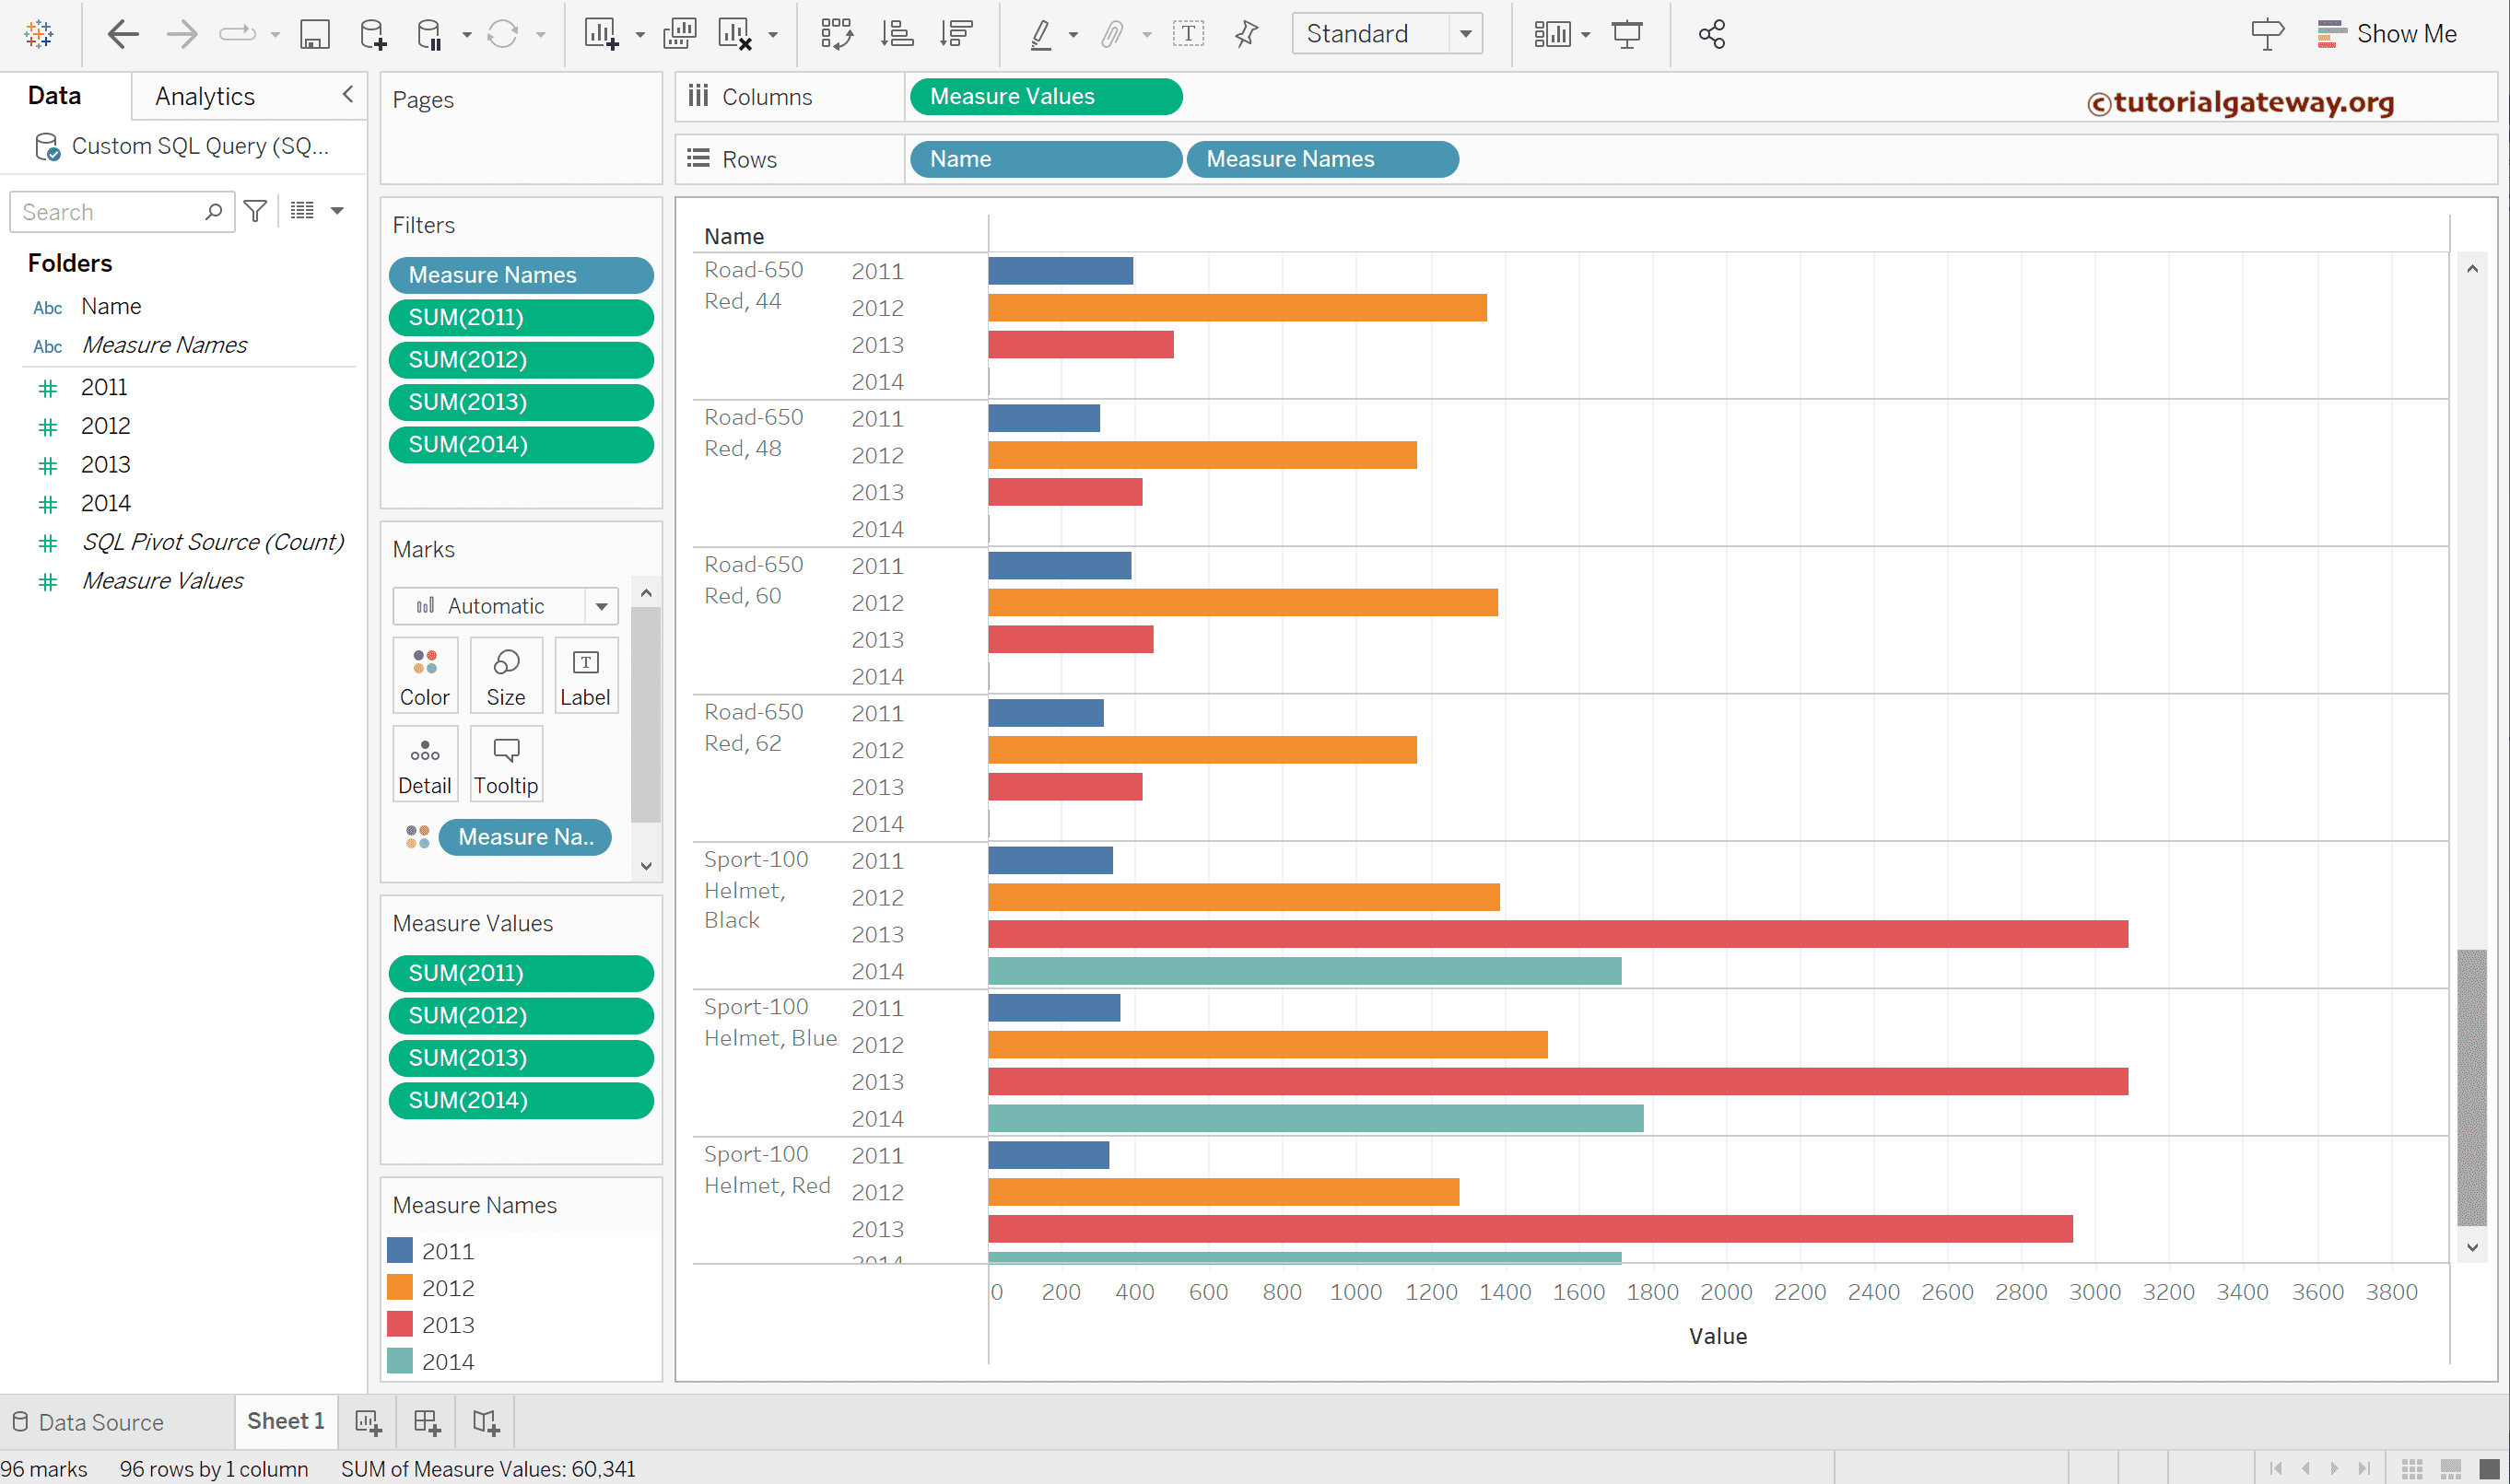
Let me design a simple horizontal side-by-side bar chart to display the pivot data. For more Charts, please refer to the Tableau Charts article.