The Python numpy logspace function generate evenly spaced numbers on a log scale within a range. The syntax of the numpy logspace is
numpy.logspace(start, stop, num = 50, endpoint = True, base = 10.0, dtype=None, axis = 0)
The arguments of the Python numpy logspace array function are
- start – Starting value, i.e., base ** start
- start – End value, i.e., base ** stop
- num – Total samples to generate.
- endpoint – If you set it to True, it includes the last sample; otherwise, it is not.
- base – Provide the base value of the log spaces.
- dtype – The data type of an output array.
- axis – If start and stop values are arrays, it is helpful.
Python numpy logspace
It is a simple example of having the start and stop arguments.
import numpy as np

a  = np.logspace(1, 2)
print(a)
[ 10.          10.48113134  10.98541142  11.51395399  12.06792641
  12.64855217  13.25711366  13.89495494  14.56348478  15.26417967
  15.9985872   16.76832937  17.57510625  18.42069969  19.30697729
  20.23589648  21.20950888  22.22996483  23.29951811  24.42053095
  25.59547923  26.82695795  28.11768698  29.47051703  30.88843596
  32.37457543  33.93221772  35.56480306  37.2759372   39.06939937
  40.94915062  42.9193426   44.98432669  47.14866363  49.41713361
  51.79474679  54.28675439  56.89866029  59.63623317  62.50551925
  65.51285569  68.6648845   71.9685673   75.43120063  79.06043211
  82.86427729  86.85113738  91.0298178   95.40954763 100.        ]
Example 2
np.logspace(1, 3, num = 5) will generate five samples start from 1 and stops at 3. So, the first value will be base ** 1, and the base value is the default 10. So, the first one = 10 ** 1 and last one = 10 ** 3
b = (1.0, 5.0, num = 5, base = 2). Start value = 2 ** 1 and stop = 2 ** 5
In the third line, we used endpoint = False so that the stop value would be less than 5. In the fourth line, the dtype = int will convert the result to integers.
import numpy as np

a  = np.logspace(1, 3, num = 5)
print(a)

b  = np.logspace(1.0, 5.0, num = 5, base = 2)
print(b)

c  = np.logspace(1.0, 5.0, num = 5, endpoint = False, base = 2)
print(c)

d  = np.logspace(1.0, 5.0, num = 5, base = 2, dtype = int)
print(d)
[  10.           31.6227766   100.          316.22776602 1000.        ]
[ 2.  4.  8. 16. 32.]
[ 2.          3.48220225  6.06286627 10.55606329 18.37917368]
[ 2  4  8 16 32]
Python numpy array logspace function
We used the arrays as the start and stopped values in this example.
np.logspace(start = [1, 5], stop = [5, 10], num = 6, base = 2) will generate 6 numbers vertically. The first column values start from 1 and end at 5, and the second column values from 5 to 10.
In the last line, we set the axis = 1. It will horizontally generate 7 evenly spaced log scale numbers where the first row starts from 1, ends at 5, and the second from 5 to 10.
import numpy as np

a  = np.logspace(start = [1, 5], stop = [5, 10], num = 6, base = 2)
print(a)

b  = np.logspace(start = [1, 5], stop = [5, 10], num = 6, base = 2, dtype = int)
print(b)

c  = np.logspace(start = [1, 5], stop = [5, 10], num = 7, base = 2, dtype = int, axis = 1)
print(c)
[[ 2. 32. ]
[ 3.48220225 64. ]
[ 6.06286627 128. ]
[ 10.55606329 256. ]
[ 18.37917368 512. ]
[ 32. 1024. ]]
[[ 2 32]
[ 3 64]
[ 6 128]
[ 10 256]
[ 18 512]
[ 32 1024]]
[[ 2 3 5 8 12 20 32]
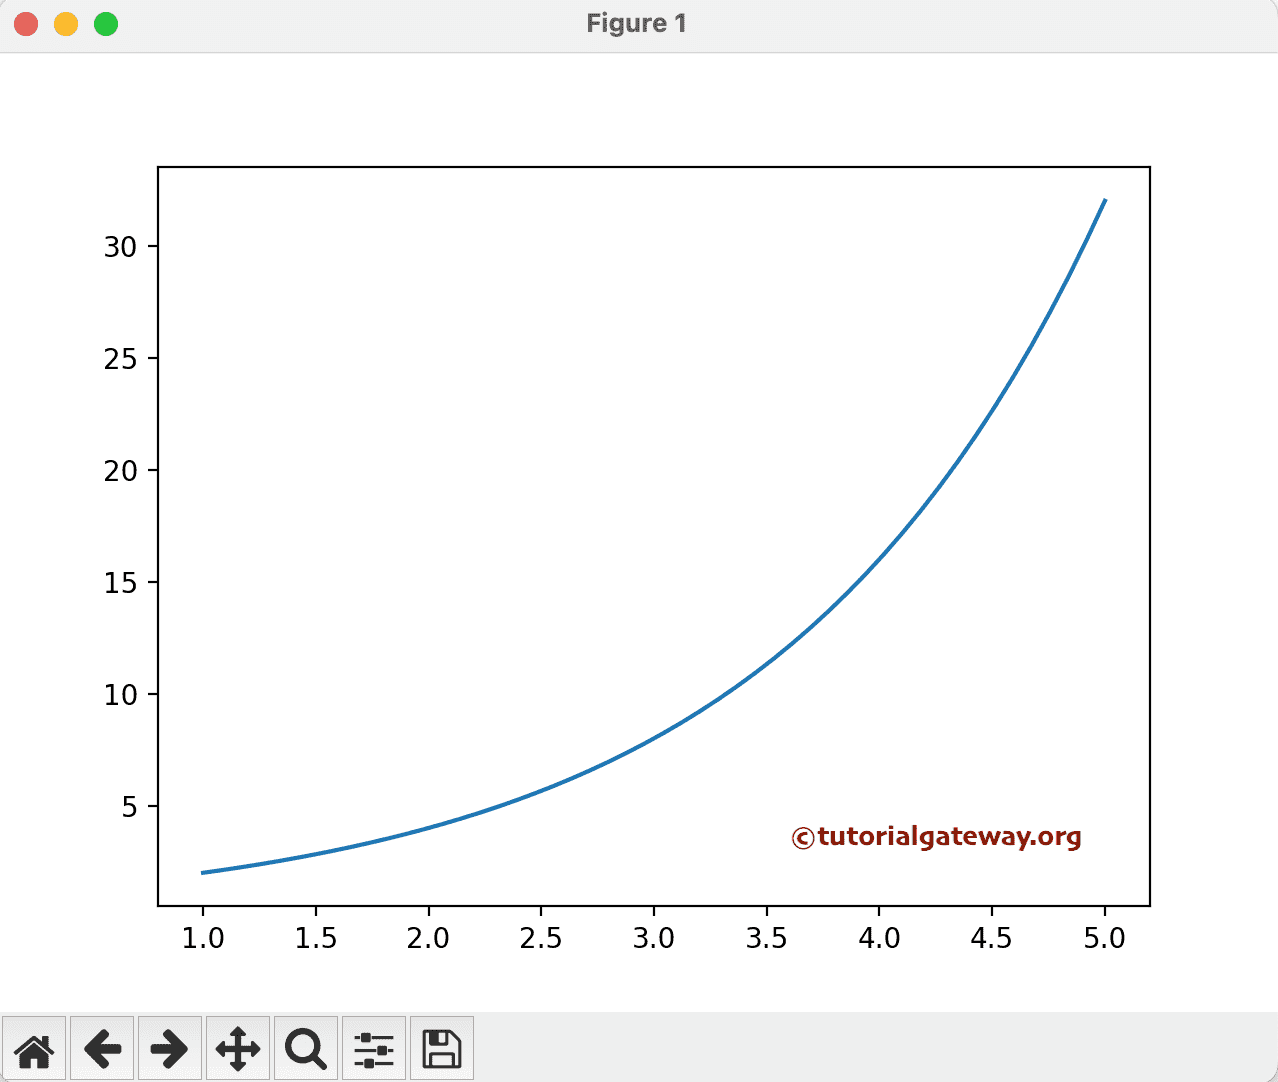
[ 32 57 101 181 322 574 1024]]In this example, we will generate a line chart using the values generated by the numpy logspace function.
import numpy as np
import matplotlib.pyplot as plt

a = np.linspace(1, 5)
b = np.logspace(1, 5, base =  2)
print(b)

plt.plot(a, b)
plt.show()