Tableau data joins play a vital role in designing reports. In real-time, we usually create reports using a database or data warehouse, and we all know that the data in the database is in normalized form. So, we can’t generate reports using a single table (mostly not, as per the business perspective).
For example, if you want to design a report for Country wise sales, Country information will be in the Geography or territory table, and Sales will be in the Sales table. We can use Tableau Joins to connect the Geography and Sales table data in these situations.
The following list will show the available Joins in Tableau to connect data.
- Inner: It returns the records (or rows) in both tables if at least one match between columns exists. Please refer to the SQL Inner article to understand it better.
- Left: This join returns all the records (or rows) in the Left table and matching rows from the right data. Please refer to the SQL Left article.
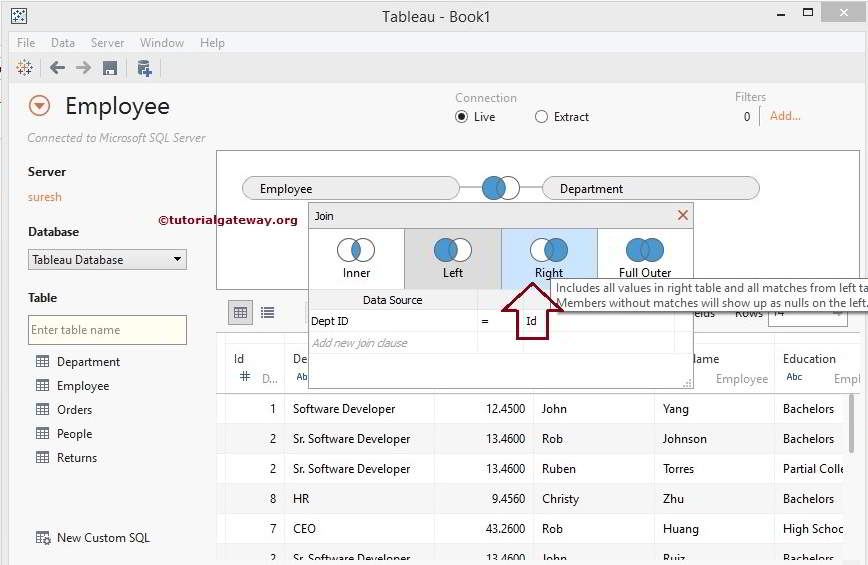
- Right: It returns all the records (or rows) present in the Right table and matches rows from the Left one. Please refer to the SQL Right article to understand it better.
- Full Outer Joins: It returns all the records (or rows) in both the Left and right tables. All the Unmatched rows will fill with NULL Values. Please refer to the SQL Full article to learn more.
Four Ways to Join Data in Tableau
This article will show you how to Join Data with a live example. For this example, we will use the data present in SQL Server, so please refer to Connecting to Server to understand the connection settings.
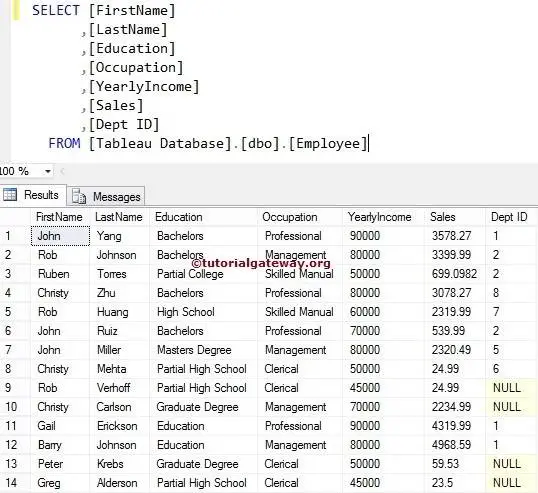
The data present in the Employee
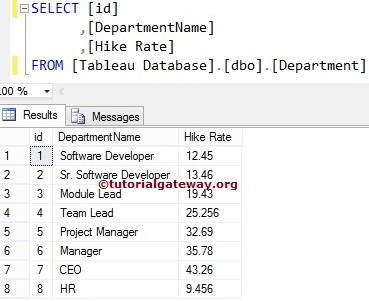
The data present in the Department
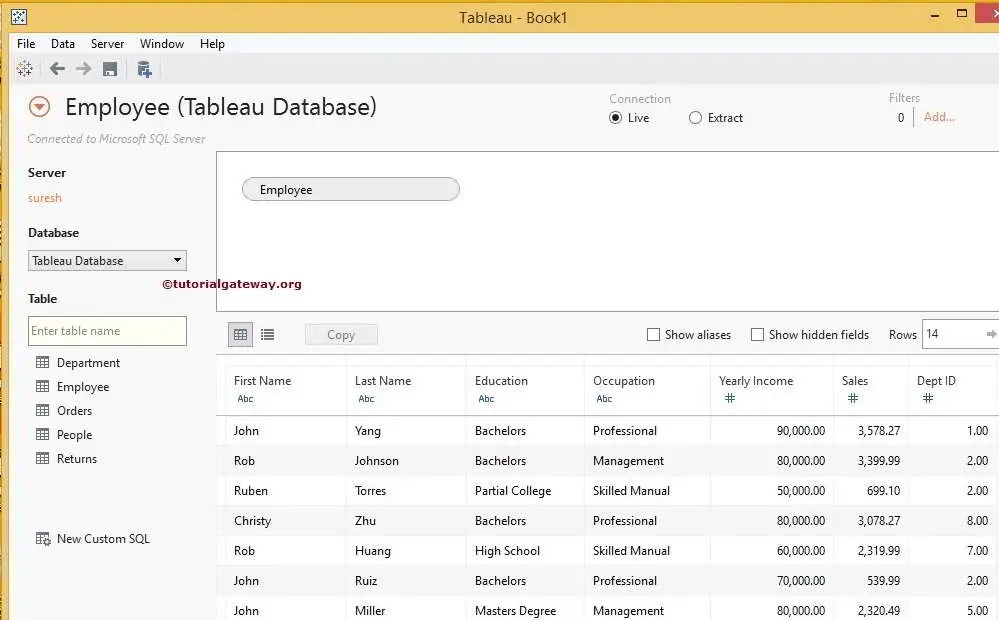
We need at least two tables to describe how to join data in Tableau. So, drag and drop the first or left table in the field region. In this example, we use our Employee table as a left table.
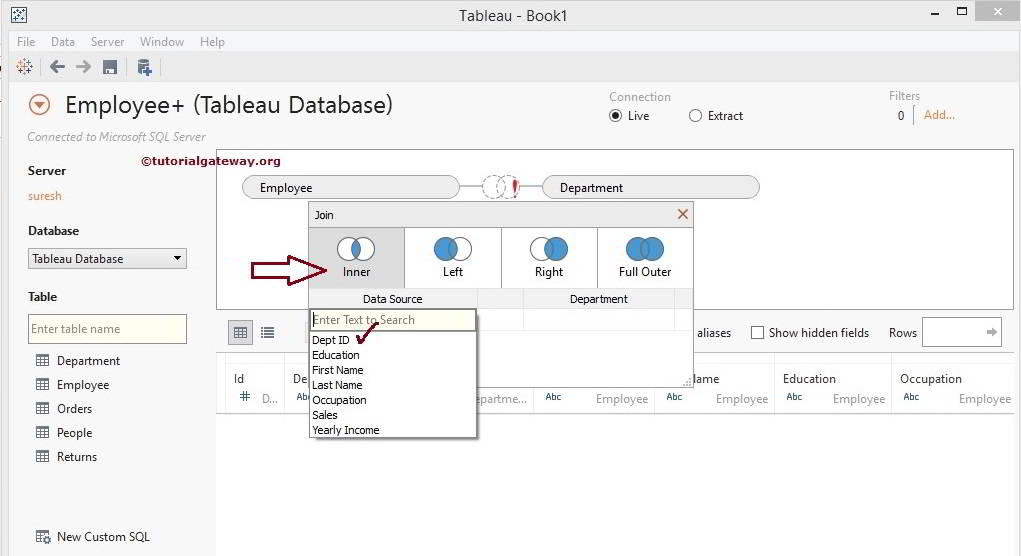
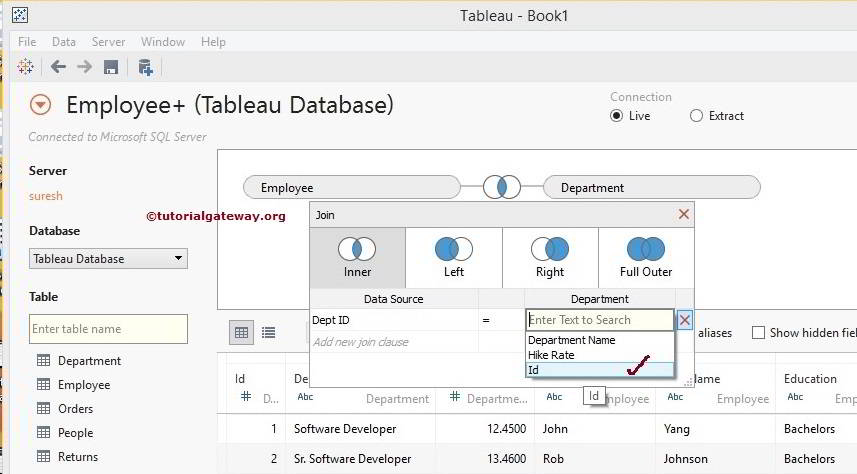
Next, drag and drop the second or right table to the field region. For example, when you drag the Department, a pop-up window will open to select the Join type and key, as shown below.
Tableau Inner Join Example
This example shows how to join data using the Inner. As we all know, the Dept ID in the Employee table and Id in the Department table are the key columns we will use for combining the Employee and Department tables. So, first, select the Dept ID column from the Employee, as shown below.
Next, select the common ID column from the department table, as shown below.
We created a simple table report with Occupation, Last name, Department name, First name on Rows, Sales Amount, and Yearly income in columns. Let us see the Inner join report preview.
From the screenshot below, you can observe that the Inner join is producing 10 Rows, which includes all the matching records from the Employee and Department table.
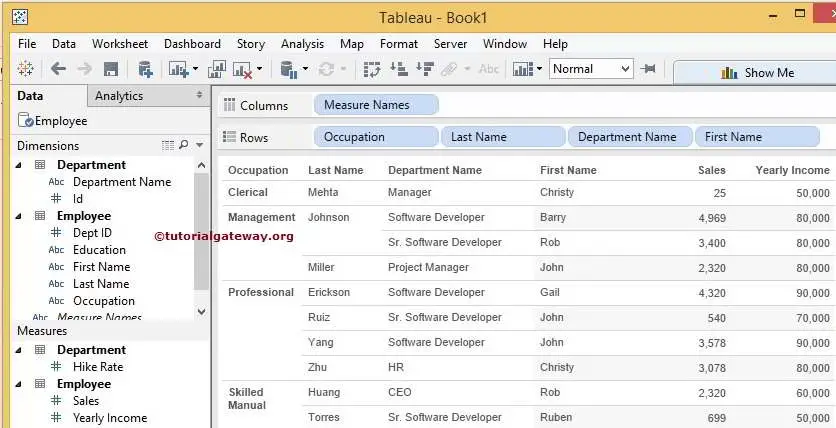
Tableau Left Join Example
This example shows you how to join data using left outer. For this, let us change the type from Inner to Left join.
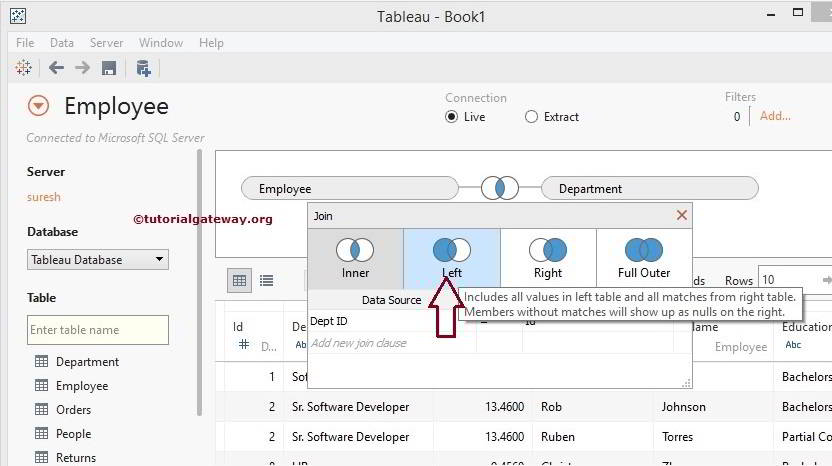
Let us see the Left join report preview. From the screenshot below, you can see that the Left join is producing 14 Rows. It includes all the Employee records and the Department matching records. Remember, four non-matching records from the Department will display as Nulls.
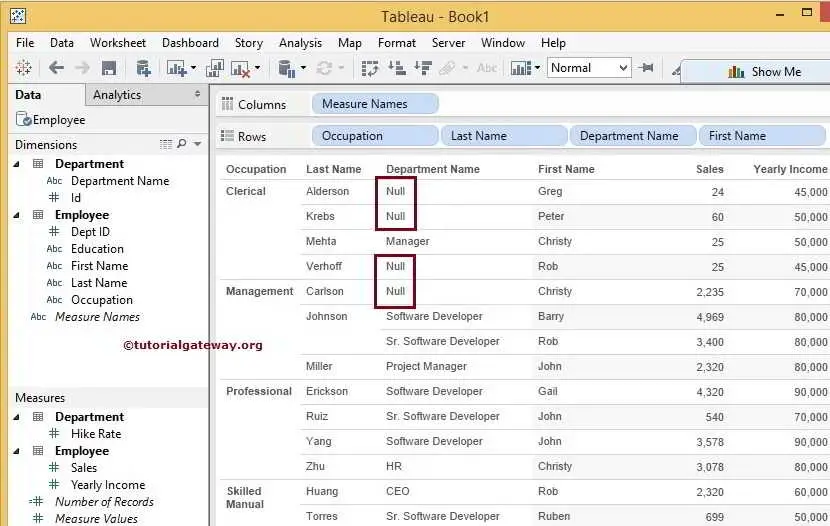
Tableau Right Join Example
This Right Join example shows you how to connect data using the Right. But first, let us change the type from Left to Right join.
Let’s see the report preview. From the image below, you can observe that the Right join is producing 12 Rows. Output includes all records from the Department and matching records from the Employee table. Remember, two non-matching records from the Employee will display as Nulls.
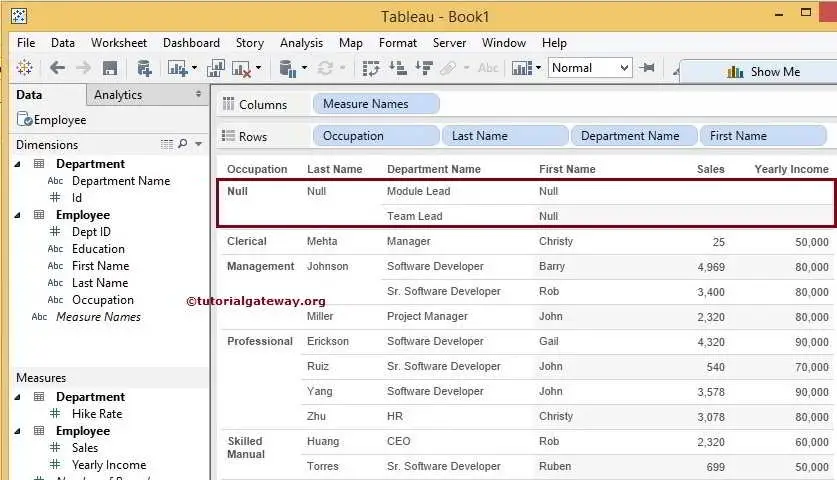
Tableau Full Outer Join Example
This example explains how to join data using Full Outer or Full. For this, let us change the type from Right to Full Outer join.
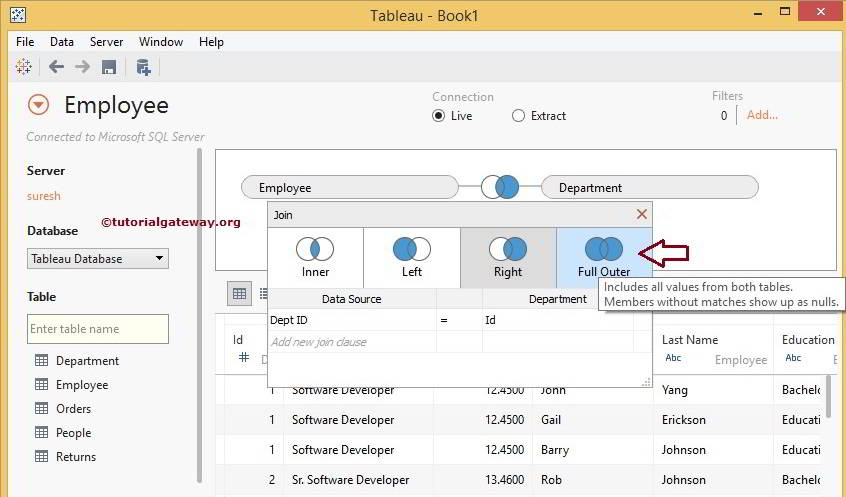
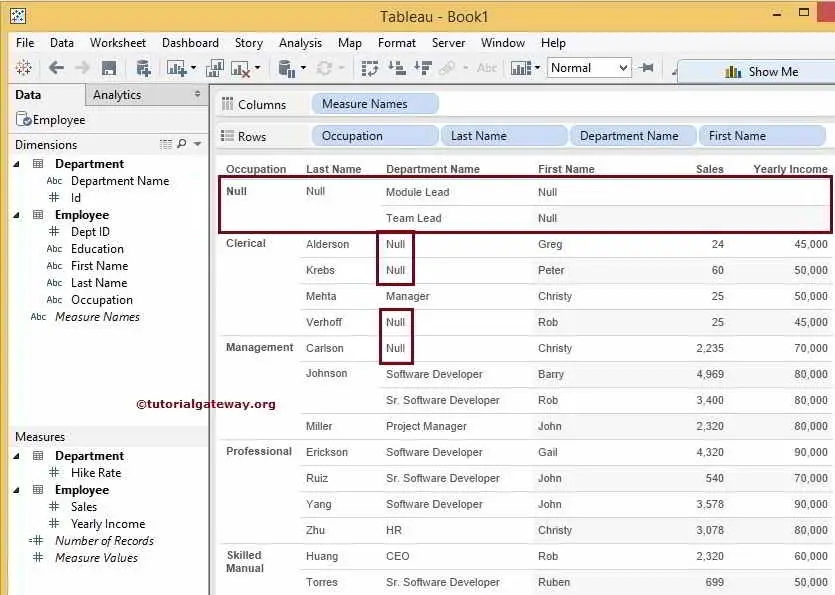
Let us see the Full Outer Joins data report preview. From the following screenshot, you can see that Full Outer is producing 16 Rows. It includes 2 Non-matching records from the Employee and four non-matching records from the Department.
NOTE: Using this method, you can connect more than two tables. Please be careful with complex joins; it won’t be easy to understand the data.
Comments are closed.