Tutorial Gateway

  • C
  • C#
  • Python
  • SQL
  • Java
  • JS
  • BI Tools
    • Informatica
    • Talend
    • Tableau
    • Power BI
    • SSIS
    • SSRS
    • SSAS
    • MDX
    • R Tutorial
    • Alteryx
    • QlikView
  • More
    • C Programs
    • C++ Programs
    • Go Programs
    • Python Programs
    • Java Programs
  • MySQL

Show Empty Records in a Power BI Report

In this section, we show you how to Show Empty Records in a Power BI Report with an example. While you create a Power BI report, Power Bi automatically hides the empty records. For example, when you create a report for state-wise sales, then it hides all the states whose sales are empty.

Show Empty Records in a Power BI Report Example 1

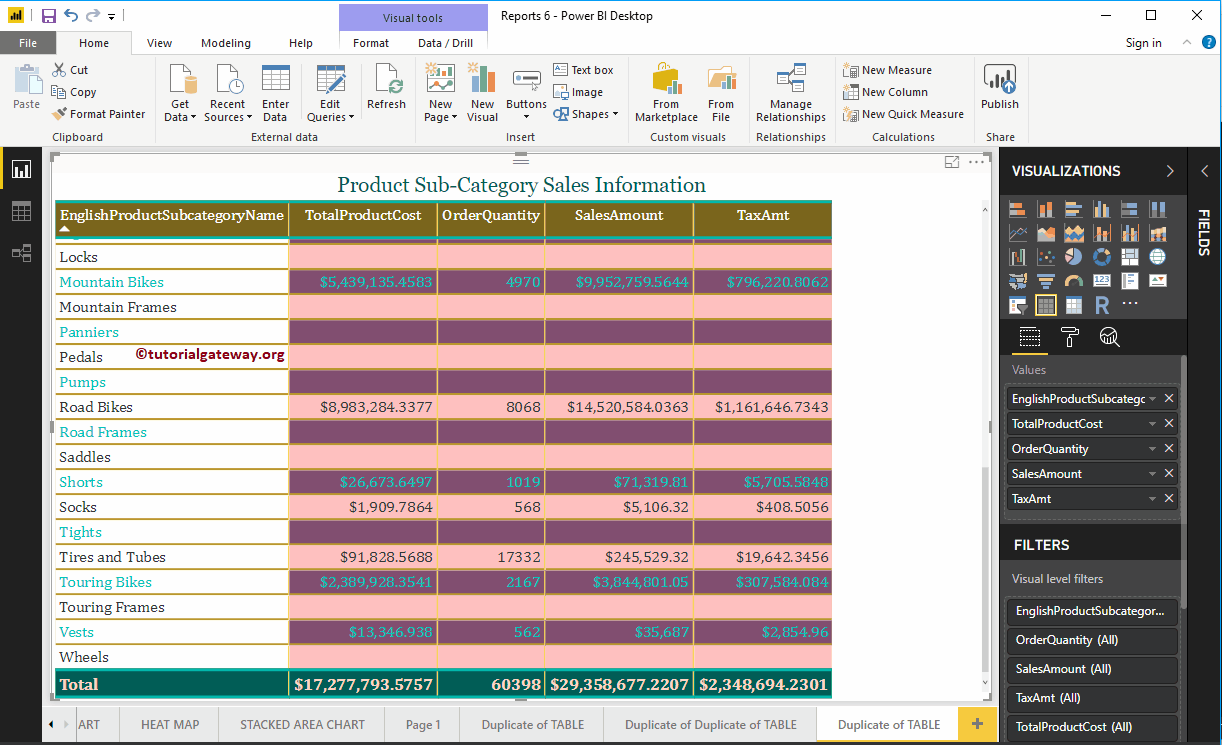
In this example, we are going to use a Table that we created in our earlier post. I suggest you refer to Create a Table article to understand the same. If you look at the Power BI table, it doesn’t have any Product Subcategory that has no sales.

Show Empty Records in a Power BI Report 1

Click the Down arrow beside the Column (or field) will open the context menu.

Show Empty Records in a Power BI Report 2

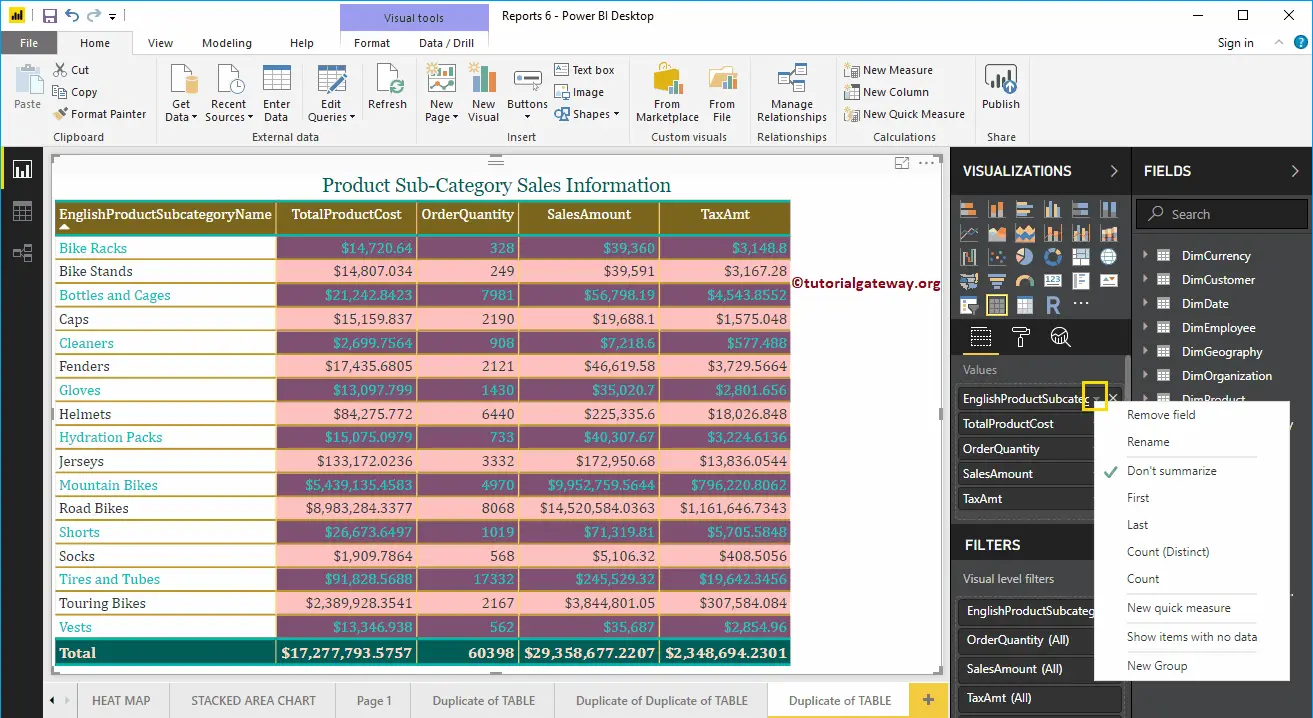
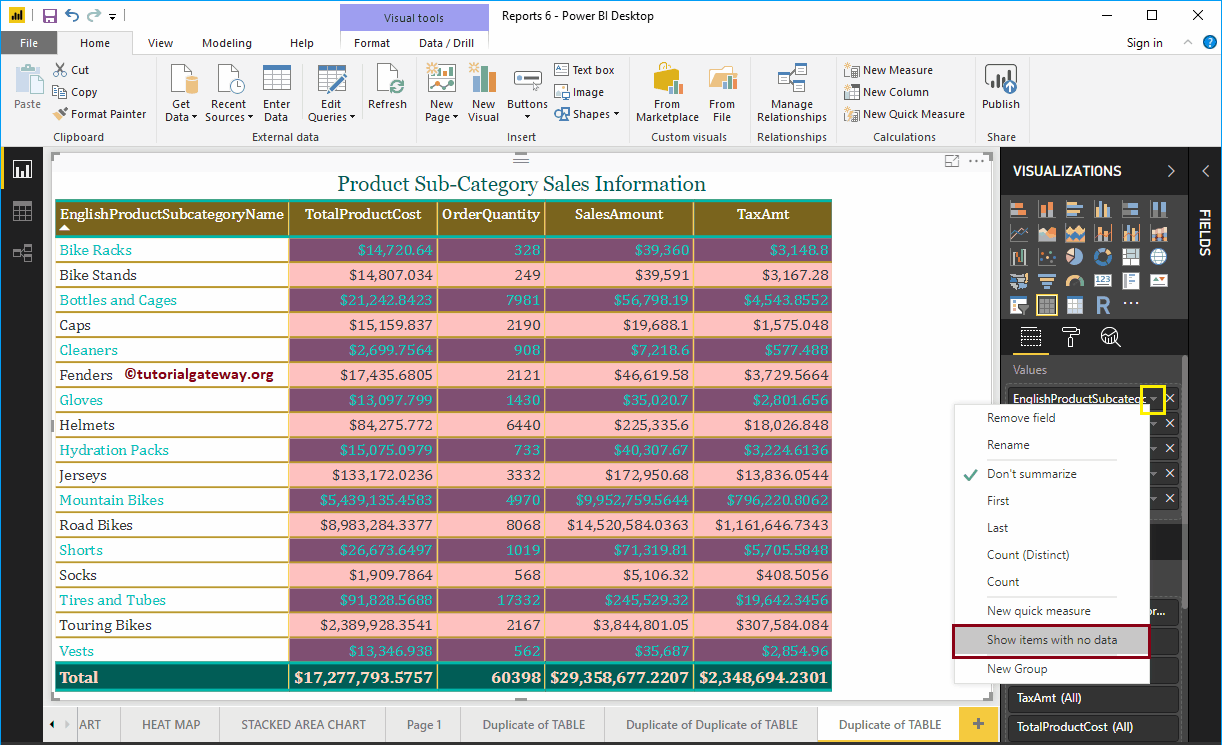
Please select Show items with no data option from the context menu.

Show Empty Records in a Power BI Report 3

Now you can see the Product Subcategory with empty sales.
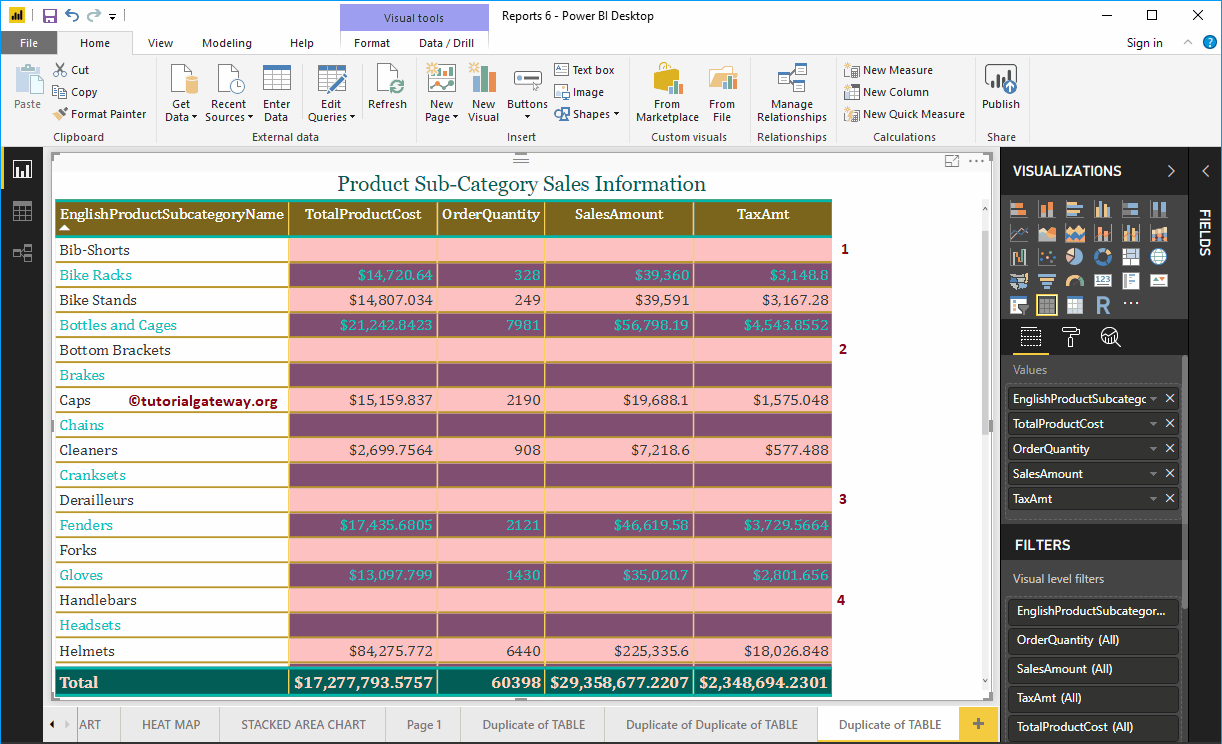
Show Empty Records in a Power BI Report 4

Let me scroll to the Table end

Show Empty Records in a Power BI Report 5

Show Empty Records in a Power BI Report Example 2

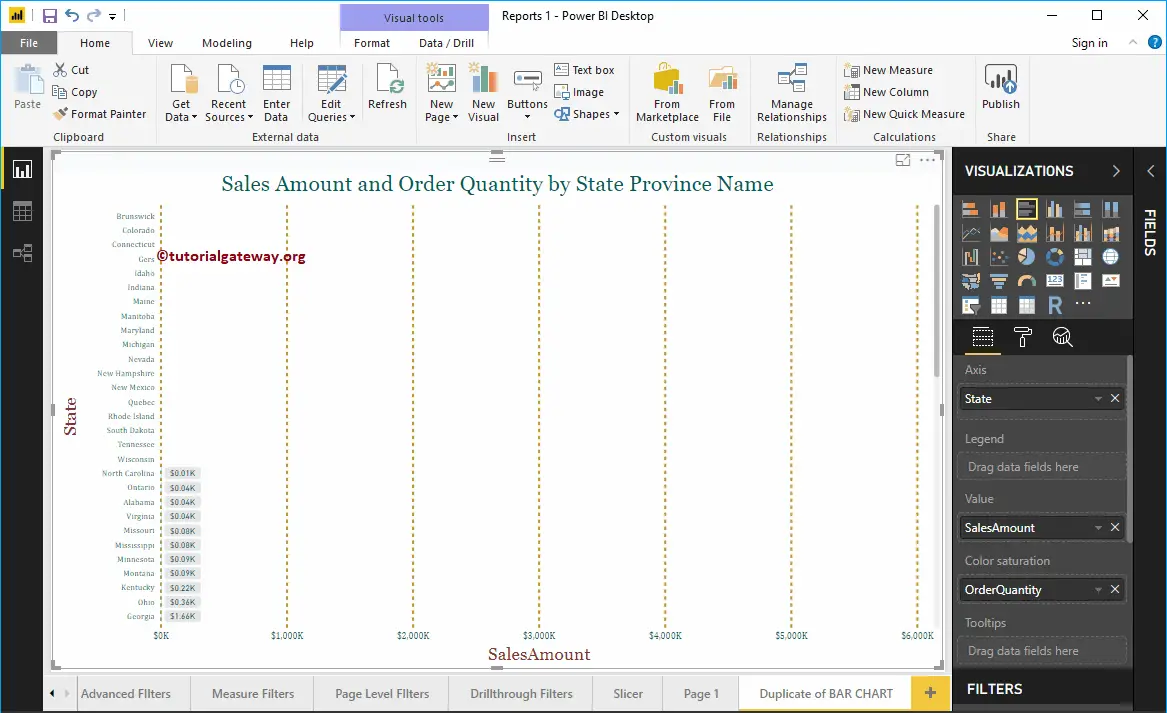
In this example, we are going to use a Bar Chart that we created before. I suggest you refer to Create a Bar Chart article to understand the same.

Show Empty Records in a Power BI Report 6

Let me sort the chart by Sales Amount in Ascending order. If you look at the chart, it doesn’t have any State that has no sales.

Show Empty Records in a Power BI Report 7

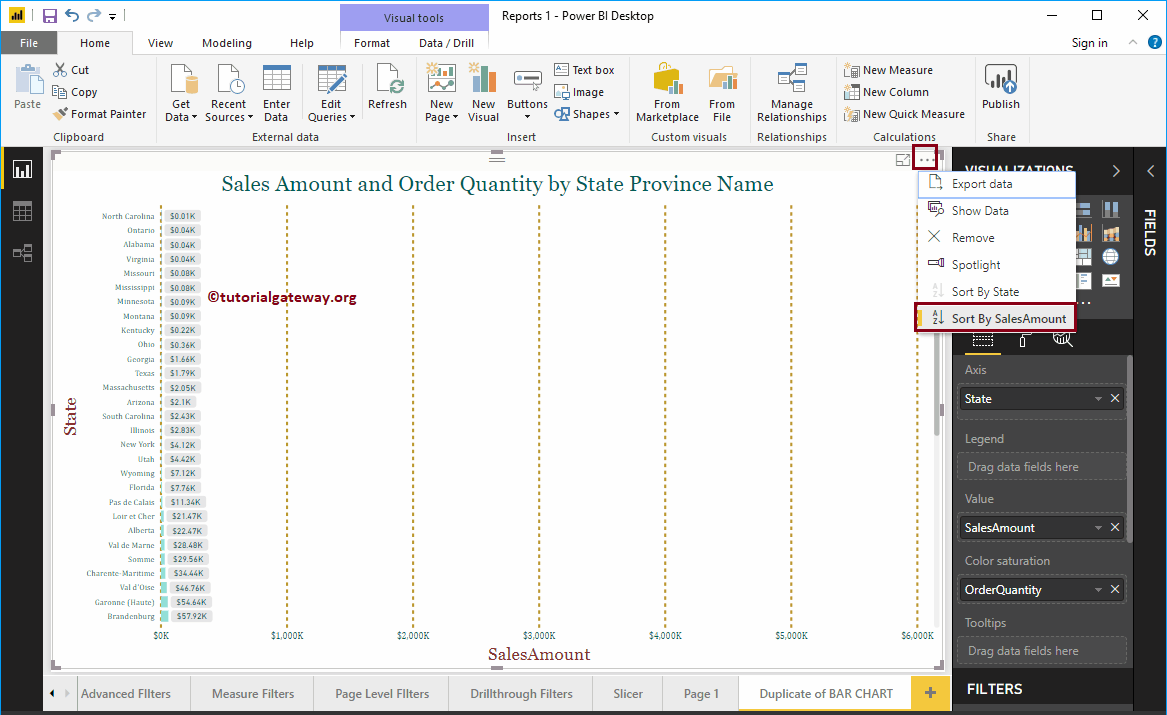
Click the Down arrow beside the State Column and select Show items with no data option from the context menu.

Show Empty Records in a Power BI Report 8

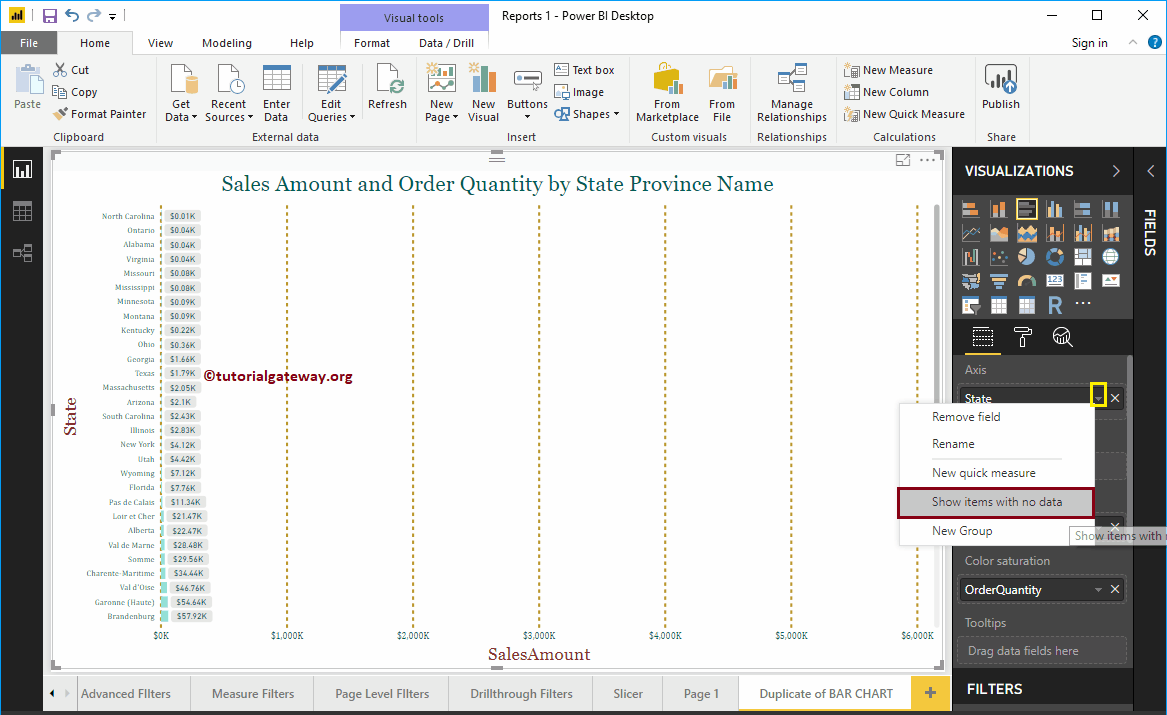
Now you can see the States with Empty Sales

Show Empty Records in a Power BI Report 9

Filed Under: Power BI

  • Install Power BI Desktop
  • Connect Power BI to SQL Server
  • Add Rename and Duplicate Pages
  • Connect to Multiple Excel Sheets
  • Get Excel Data to Power BI
  • Get Text File Data to Power BI
  • Load Data from Multiple Sources
  • Remove Power BI Table Columns
  • Create Power BI Bins
  • Power BI Joins
  • Change Column Data Types
  • Combine Multiple Tables
  • Power BI Clusters
  • How to Enter Data into Power BI
  • How to Format Dates in Power BI
  • Create Power BI Groups
  • Create Power BI Query Groups
  • Create Power BI Hierarchy
  • Power BI Pivot Table
  • Power BI Unpivot Table
  • Rename Power BI Table Names
  • Rename power bi column names
  • Split Columns in Power BI
  • Remove reorder power bi column
  • Power BI Area Chart
  • Format Power BI Area Chart
  • Power BI Bar Chart
  • Format Power BI Bar Chart
  • Power BI Clustered Bar Chart
  • Clustered Column Chart
  • Create a Power BI Card
  • Format Power BI Card
  • Create Power BI Multi-Row Card
  • Format Power BI Multi-Row Card
  • Power BI Column Chart
  • Format Power BI Column Chart
  • Power BI Donut Chart
  • Format Power BI Donut Chart
  • Power BI Funnel Chart
  • Format Power BI Funnel Chart
  • Power BI Heat Map
  • Power BI Line Chart
  • Format Power BI Line Chart
  • Line & Clustered Column Chart
  • Format Line & Clustered Column
  • Line & Stacked Column Chart
  • Format Line & Stacked Column
  • Power BI Matrix
  • Format Power BI Matrix
  • Power BI Table
  • Format Power BI Table
  • Add Data Bars to Power BI Table
  • Add alternate Table Row Colors
  • Power BI Pie Chart
  • Format Power BI Pie Chart
  • Power BI Ribbon Chart
  • Format Power BI Ribbon Chart
  • Power BI Treemap
  • Format Power BI TreeMap
  • Power BI Scatter Chart
  • Format Power BI Scatter Chart
  • Power BI Stacked Area Chart
  • Power BI Stacked Bar Chart
  • Format Stacked Bar Chart
  • Power BI Stacked Column Chart
  • Format Stacked Column Chart
  • Power BI Waterfall Chart
  • Format Power BI Waterfall Chart
  • Power BI 100% Stacked Bar Chart
  • 100% Stacked Column Chart
  • Create a Power BI Map
  • Format Power BI Map
  • Power BI Filled Map
  • Format Power BI Filled Map
  • Power BI Basic Filters
  • Power BI Slicer
  • Power BI Top 10 Filters
  • Power BI Drill through Filters
  • Power BI Filters on Measures
  • Power BI Advanced Filters
  • Power BI Report Level Filters
  • Power BI Page Level Filters
  • Power BI Calculated Columns
  • Add Conditional Column
  • Create Power BI Custom Column
  • Power BI Calculated Measures
  • Power BI Calculated Tables
  • Power BI DAX String Functions
  • Power BI DAX Math Functions
  • DAX Trigonometric Functions
  • Power BI DAX Date Functions
  • Power BI DAX Logical Functions
  • Power BI DAX Agg. Functions
  • Power BI Dashboard Introduction
  • Power BI Dashboard Settings
  • Power BI Dashboard Actions
  • Delete Power BI Dashboard
  • Subscribe Power BI Dashboard
  • Add Web Content to Dashboard
  • Add Image to Dashboard
  • Add video to power bi dashboard
  • Add Title to Power BI Dashboard
  • Pin Workbooks to Dashboard
  • Register to Power BI Service
  • Connect to Power BI Service
  • Create Power BI Workspace
  • Share Power BI Workspace
  • Create a Report in Workspace
  • Rename a Report in Workspace
  • Rename a Dataset in Workspace
  • Quick insights in Power BI
  • Get insights in Power BI
  • Publish power bi desktop report
  • Upload Power BI Workbooks
  • Upload Excel Files to Dashboard
  • Edit Power BI App
  • View Published Power BI App
  • Publish Power BI App
  • Share Power BI Dashboard
  • Share Power BI Workspace
  • Share Power BI Report
  • Power BI Q&A
  • Power BI Q&A Advanced
  • Customize Q&A Suggestions

Copyright © 2021· All Rights Reserved by Suresh.
About | Contact | Privacy Policy