The Power BI MONTH function is one of the DAX Date and Time functions used to return the month as a number from 1 (January) to 12 (December) from the given Date. This article explains the POWER BI DAX MONTH function that accepts the date value and returns integers from 1 to 12 as Gregorian values and the syntax is:
MONTH(<datetime>)
The DAX MONTH function takes the date value from the given datetime or text representation of the date as an argument and extracts the month from it.
- The argument can be a date, datetime, or the expression that returns or is implicitly convertible to the datetime or date.
- When the datetime argument is the text representation, MONTH uses current local date and time settings to understand a text. If it can’t convert correctly, the MONTH function returns an error.
Power BI DAX MONTH function Example
To demonstrate the DAX MONTH() function, we use the Order Date column from the SuperStore Orders table. To extract the month for each date row, go to the Modeling Tab and click the New Column button. Next, rename it as Month to obtain the month number (1 to 12) from the Order date.
Next, please add the new Month column to the table report. Please refer to the DateTime and the function article for the remaining Power BI methods. For more Charts >> Click Here.
Month = MONTH(Orders[Order Date])

You can try the below expression and it returns the same result.
Months = Orders[Order Date].[MONTH]
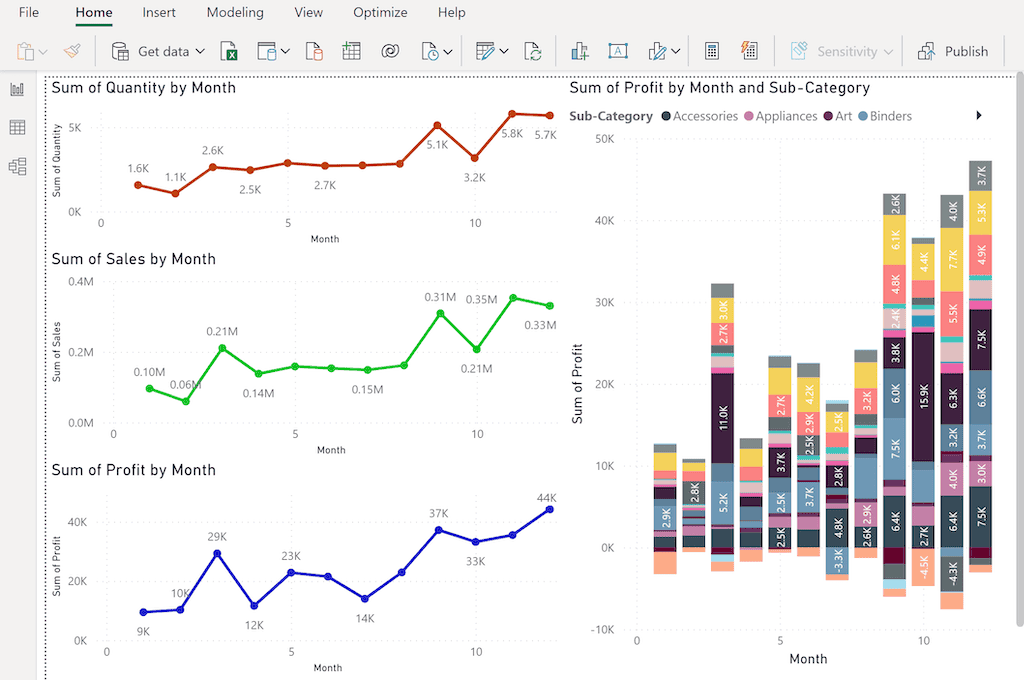
Let me create three line charts to show the month-wise sales, orders, and profit. Next, we created a Stacked Column Chart with X-Axis Month, Y-Axis Profit, and Legend Sub-Category. You can click on any part of the Stacked Column Chart. It will show or highlight the monthly results in a particular Subcategory.