The Table Box in QlikView is a sheet object which is useful to show several different fields simultaneously from one or more internal tables. Let us see the steps involved in creating a table box with an example. For this Table Box demo, we are going to use the data present in the following Excel table.
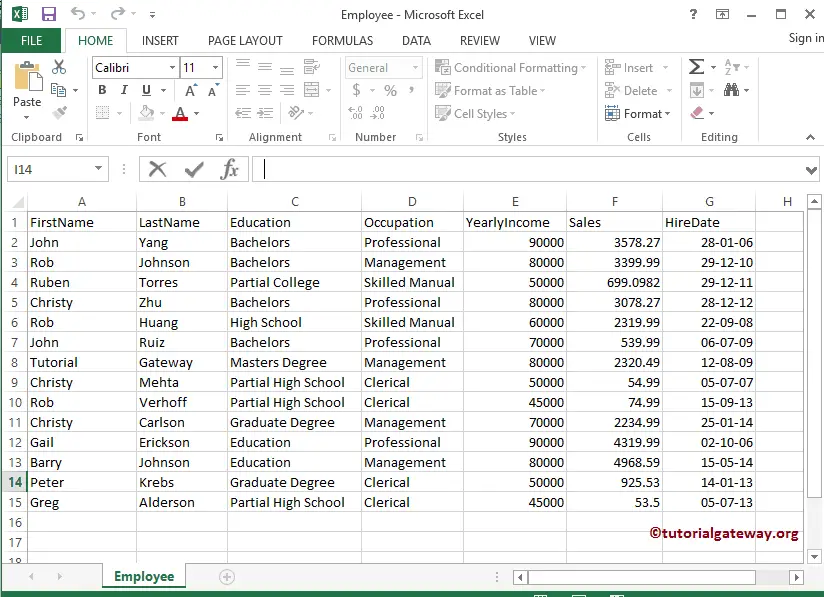
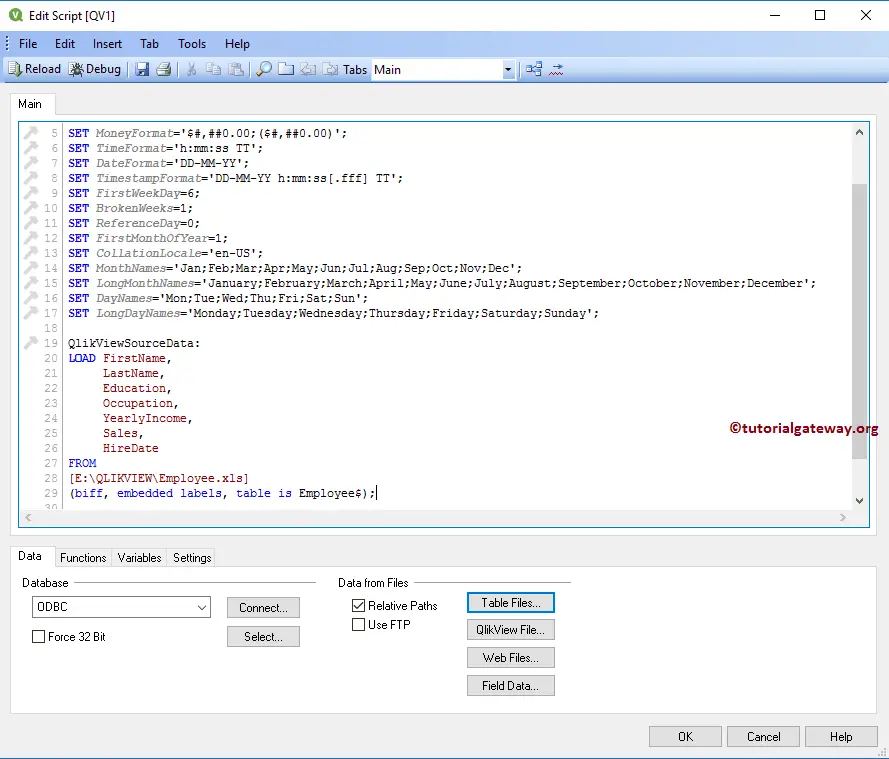
From the screenshot below, see that we are loading the above specified excel sheet into the QlikView.
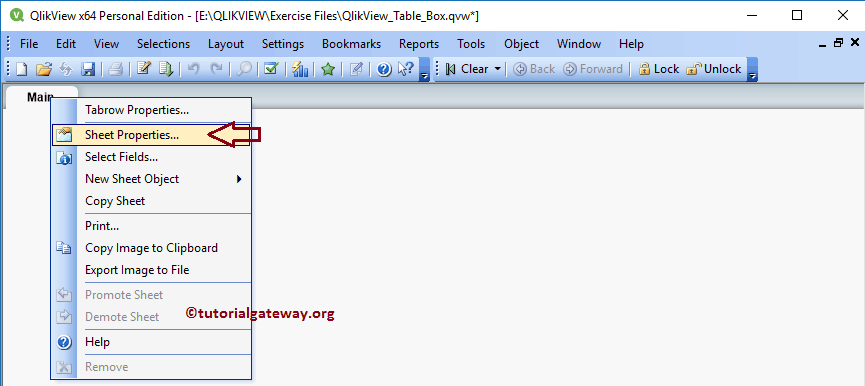
Right-click on the Main tab and select the Sheet Properties.. to change the tab name as per requirements. Here, we are changing it to Table Box
Creating Table Box in QlikView
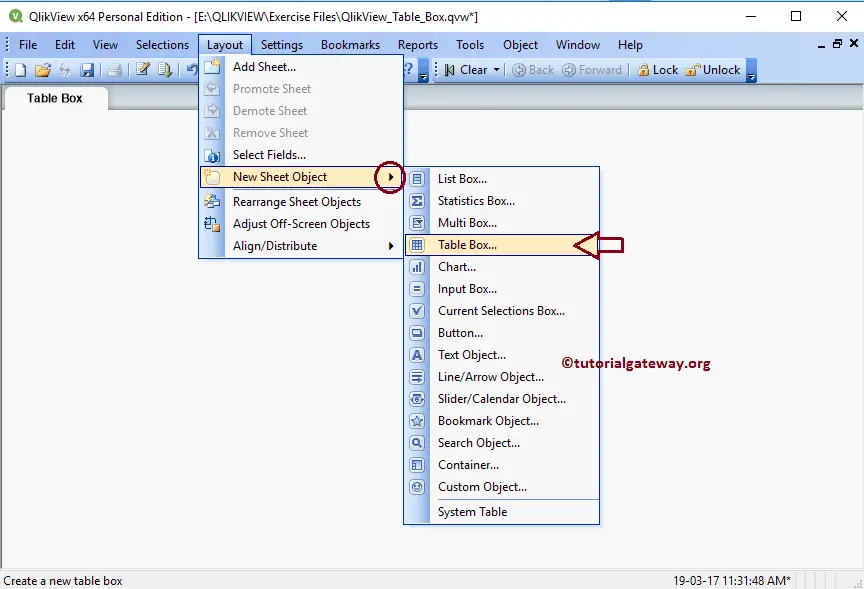
We can create a table box in multiple ways: Please navigate to Layout Menu, select the New Sheet Object, and then select the table Box.. option
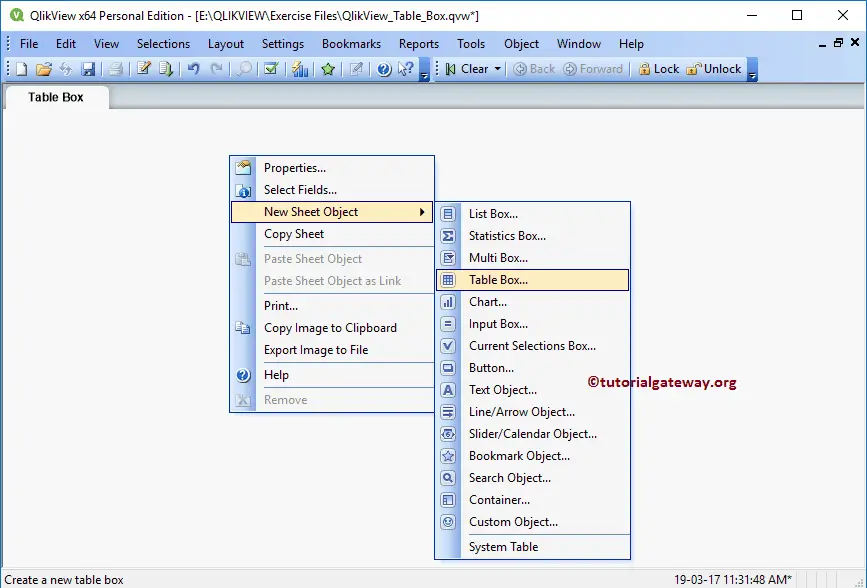
The second approach is to right-click on the Empty report area and open the Context menu. Please select the New Sheet Object, and then select the table Box.. option. Alternatively, click on the Create Table Box shortcut present in the toolbar.
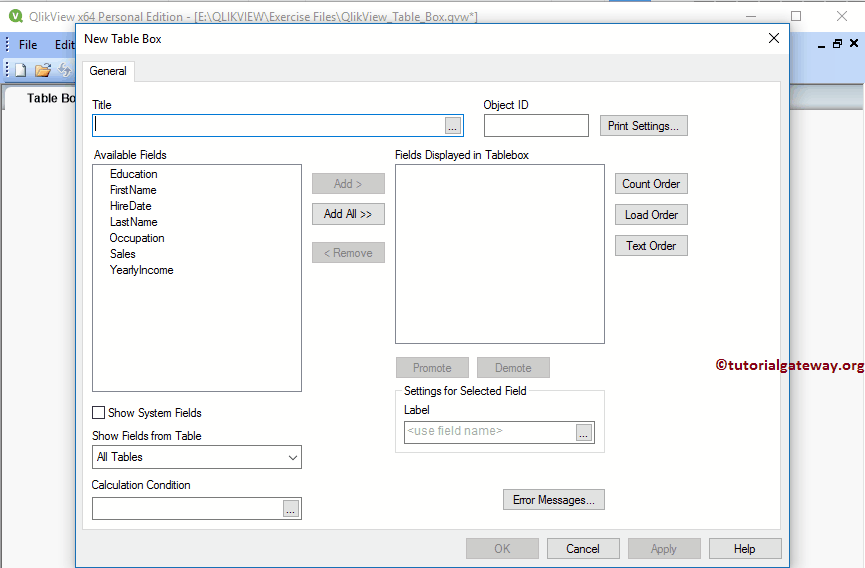
Either way opens a new window called New Table Box. Refer Import data from Excel to QlikView article in QlikView to import the excel tables.
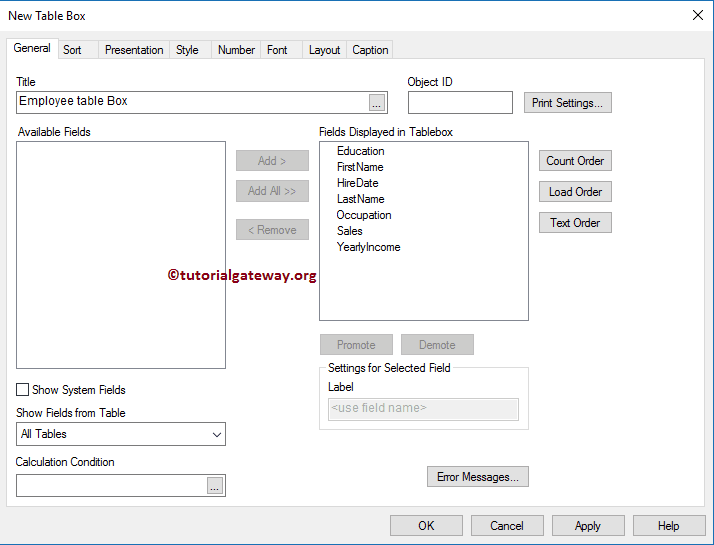
We added all the available fields into the Table Box by clicking the Add All >> button. Though this window has many properties, we will not discuss them in this article. So, click Apply to apply the changes, and then click OK to close the window. Visit the QlikView Table Box Properties article to understand each property present in this window.
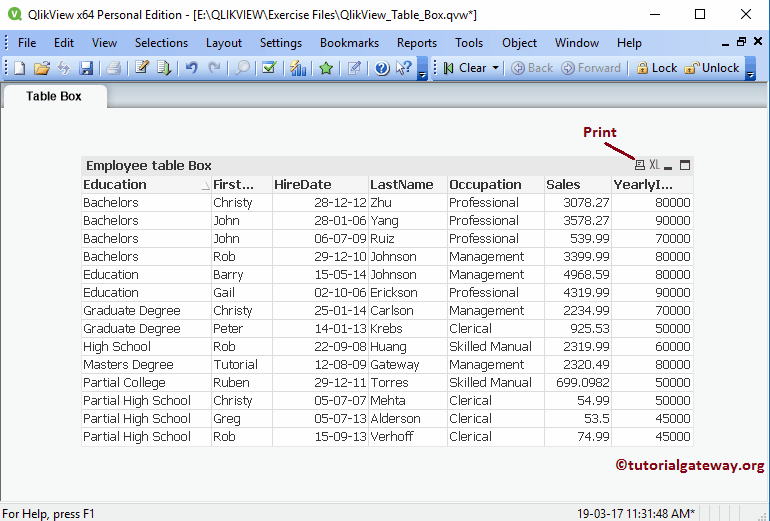
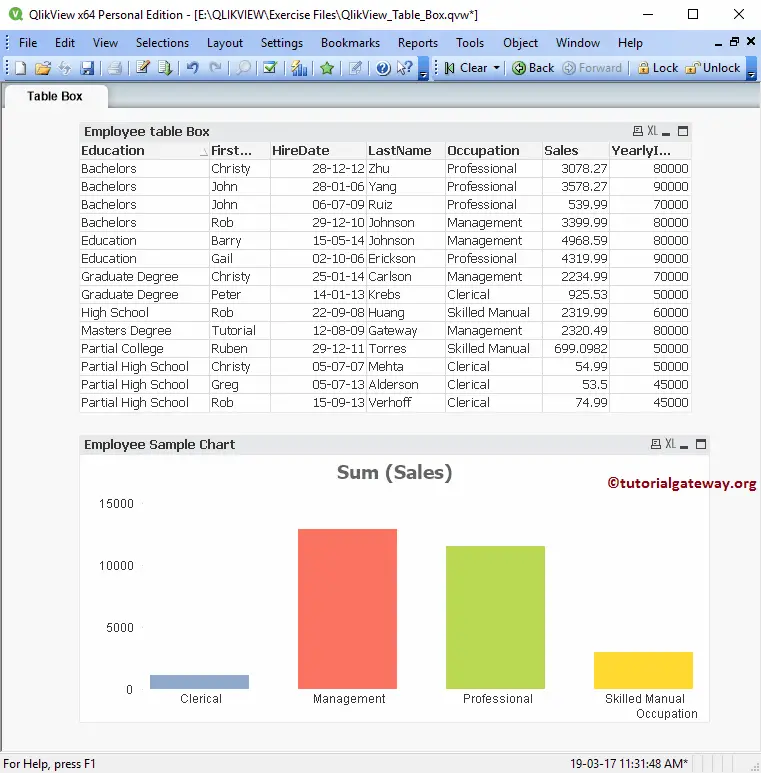
Now, see our newly created table report in QlikView.
Use this QlikView table Box to filter the data present in Charts or other boxes present in the sheet. To demonstrate this concept, we are adding a Bar Chart to this existing Table Box sheet.
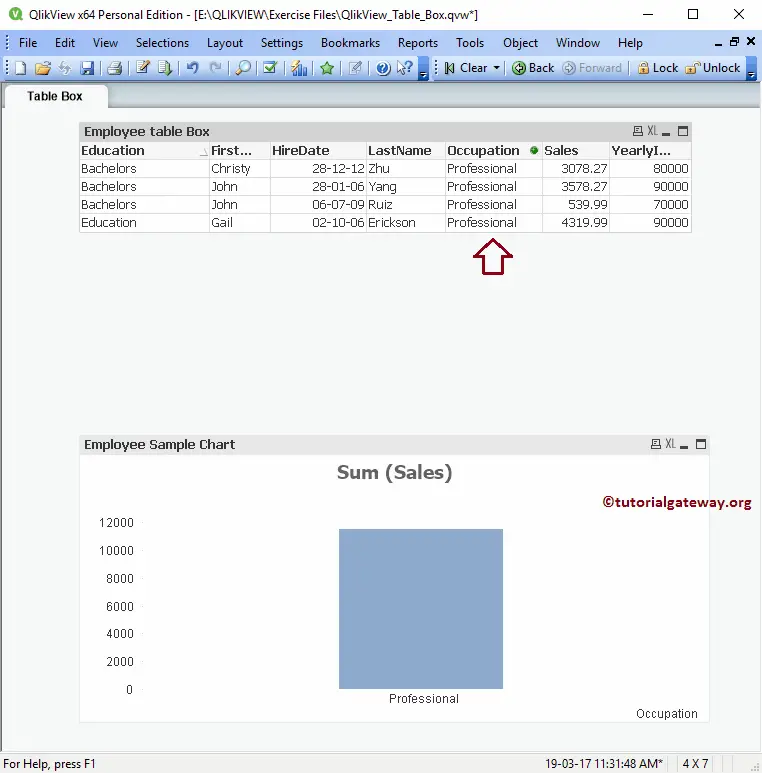
From the screenshot below, see when we click on the Professional row in the Table box. The Bar chart displays the Bar for Professionals only.
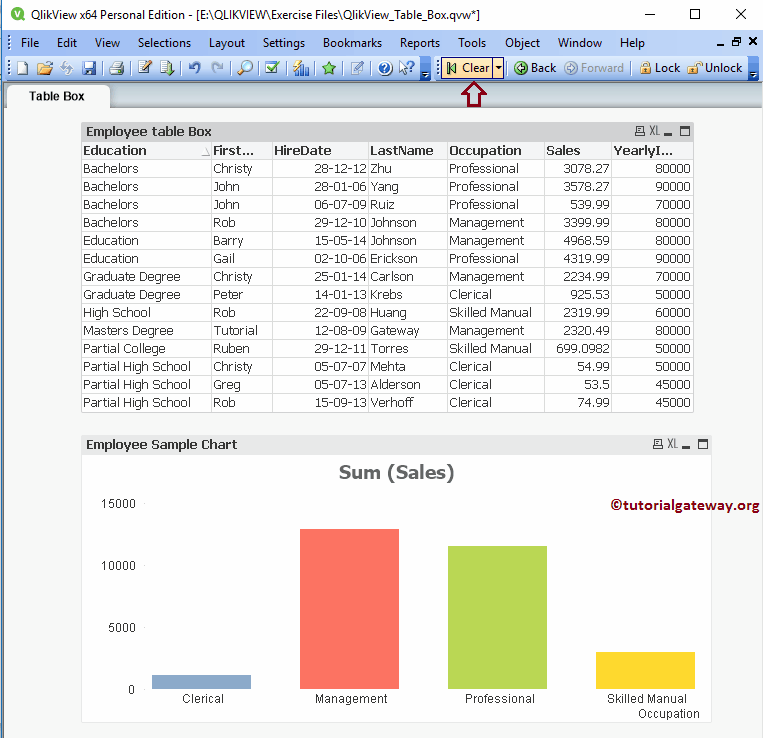
Use the Clear shortcut to undo the Filter or selection
Comments are closed.