In this article, we will show you how to add Alternative Row Color to the SSRS Report. It is one of the Frequently asked questions by users. So, here, we will show you the step-by-step approach to adding Alternative Row Colors to the Report using an Expression with an example.
We are going to use the below-shown DataSet to explain the same. Please refer to the Embedded Data Source and Dataset articles to understand the steps involved in creating the Embedded Data Source and Dataset we used for this SSRS report. The Custom SQL query that we used in the above Dataset is:
SELECT [FirstName] +  ' ' + [LastName] AS FullName
      ,[Education]
      ,[Occupation]
      ,[YearlyIncome]
      ,[Sales]
      ,[HireDate]
  FROM [Employee]
How to add Alternative Row Color to SSRS Report
We are going to use the previously designed report, as we have shown below. Please refer to the Table, Format Table article to understand the steps involved in creating Table & format. Next, visit the headers and Footer article for adding Page headers and footers. Let me show you the Preview.
When you select the details row, you have an option called Background color in the properties pane. You can use all the predefined ones if you want to make the standard color for all the records returned by the report.
Add Alternative Row Color to SSRS Report
Here our task is to add an alternate row color to the SSRS Report. It means we have to use some conditions to check for alternating rows.
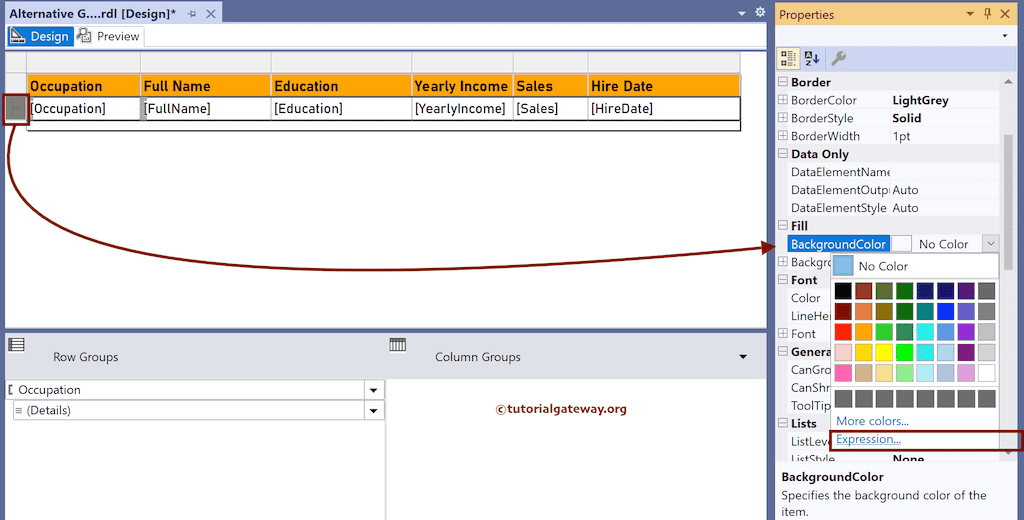
To do so, Please click on the Expression hyperlink under the Background Color property.

Once you click on the Expression hyperlink, a new window called Expression will open. Use this expression window to find them.
Within the Expression window, we will use the IIF condition to check whether the row number is even or not. If it is even, Pale Turquoise, otherwise Plum. By this, we can add alternative row colors to the SSRS report.
=IIF(RowNumber(Nothing) MOD 2 = 0, "PaleTurquoise", "Plum")
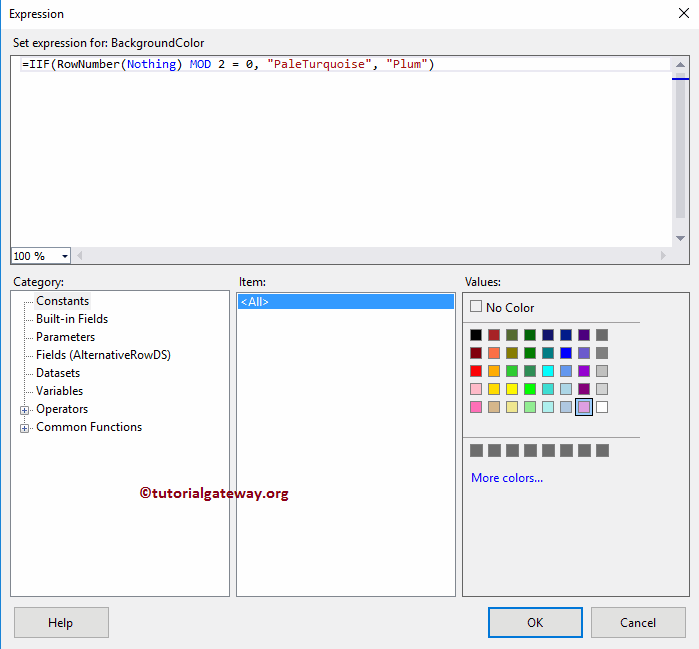
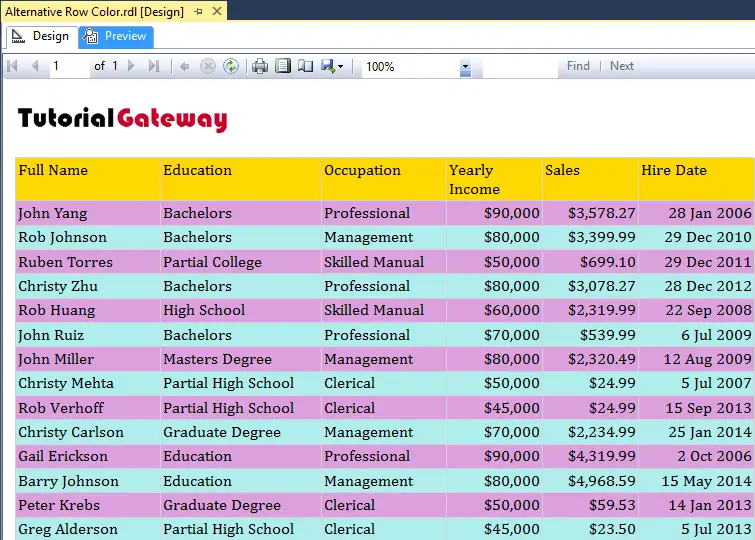
Once completed, Click OK to close the window. As you can see, our report preview displays the specified colors as the alternate row color in the Report.
Add Alternative Background Color to SSRS Table Report Group Rows
This report article shows how to change the alternative background colors of a table group rows using the IIF condition or expression. It displays color based on the group.
Right-click on the Datasets folder to create a new DataSet. The below screenshot shows the data set that we use for this example. The Sql query that we used above SSRS example is:
SELECT [FirstName] +  ' ' + [LastName] AS FullName
      ,[Education]
      ,[Occupation]
      ,[YearlyIncome]
      ,[Sales]
      ,[HireDate]
  FROM [Employee]
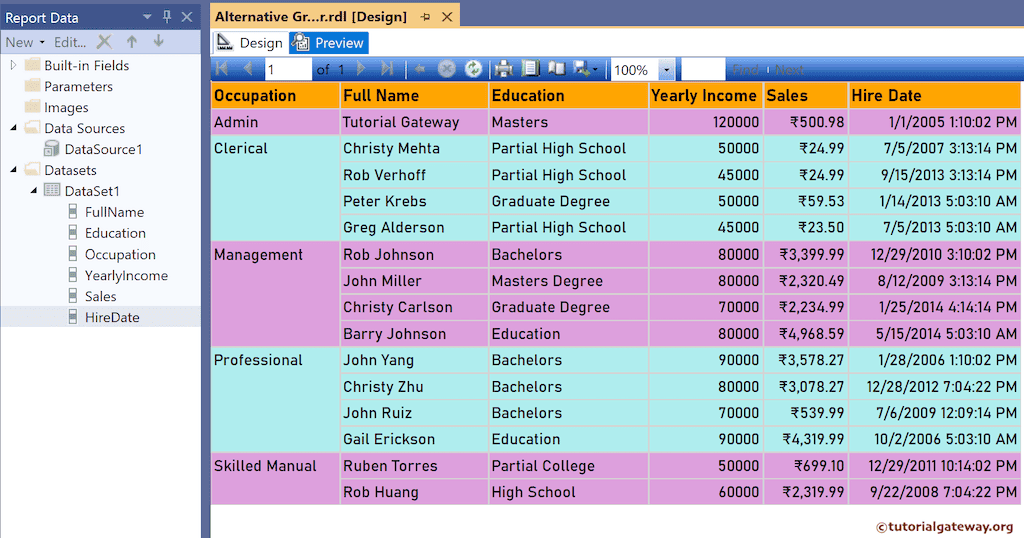
We have designed a simple table report of Employees and formatted the font and colors. To add the alternative background Colors to SSRS Table Report Group Rows, under the Row group section, click the down arrow beside the details and select Add Group and Parent Group. Next, choose the Occupation column as the group by option and click the OK button. Please check the report preview as the Employee table is grouped into (4 groups) in the Occupation column.

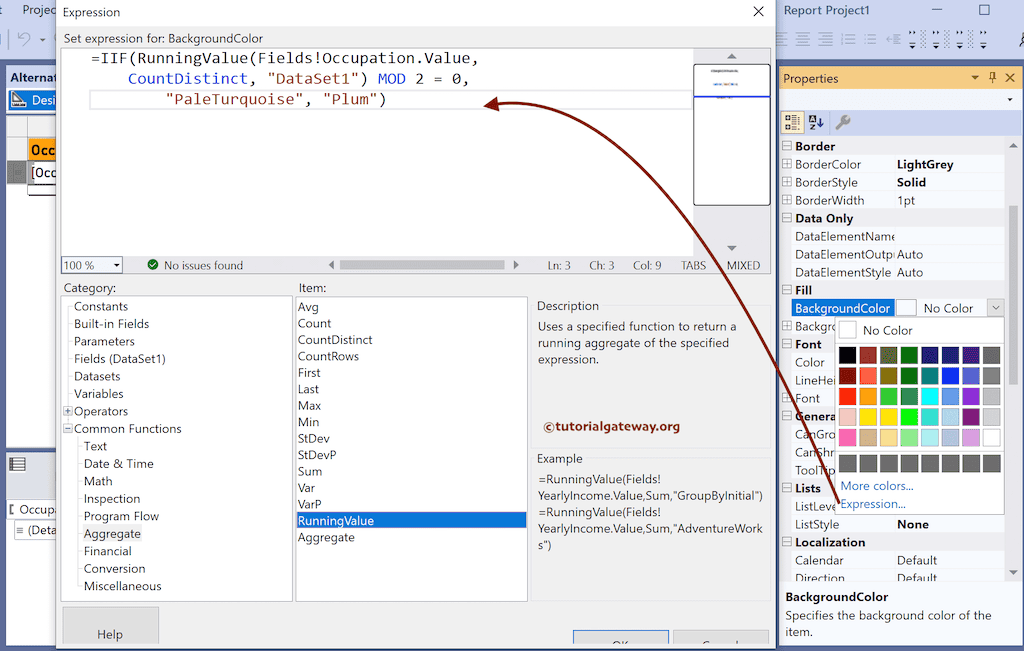
Select the Details row, go to the Background Color property, and click the Expression hyperlink.
The below iif statement uses the RunningVlaue function, which assigns a unique number to each group. Next, we used the MOD function to find the remainder. If the remainder is zero, it is an even group, so assign a Pale Turquoise color. Otherwise, Plum in color.
=IIF(RunningValue(Fields!Occupation.Value, CountDistinct, "DataSet1") MOD 2 = 0, "PaleTurquoise", "Plum")
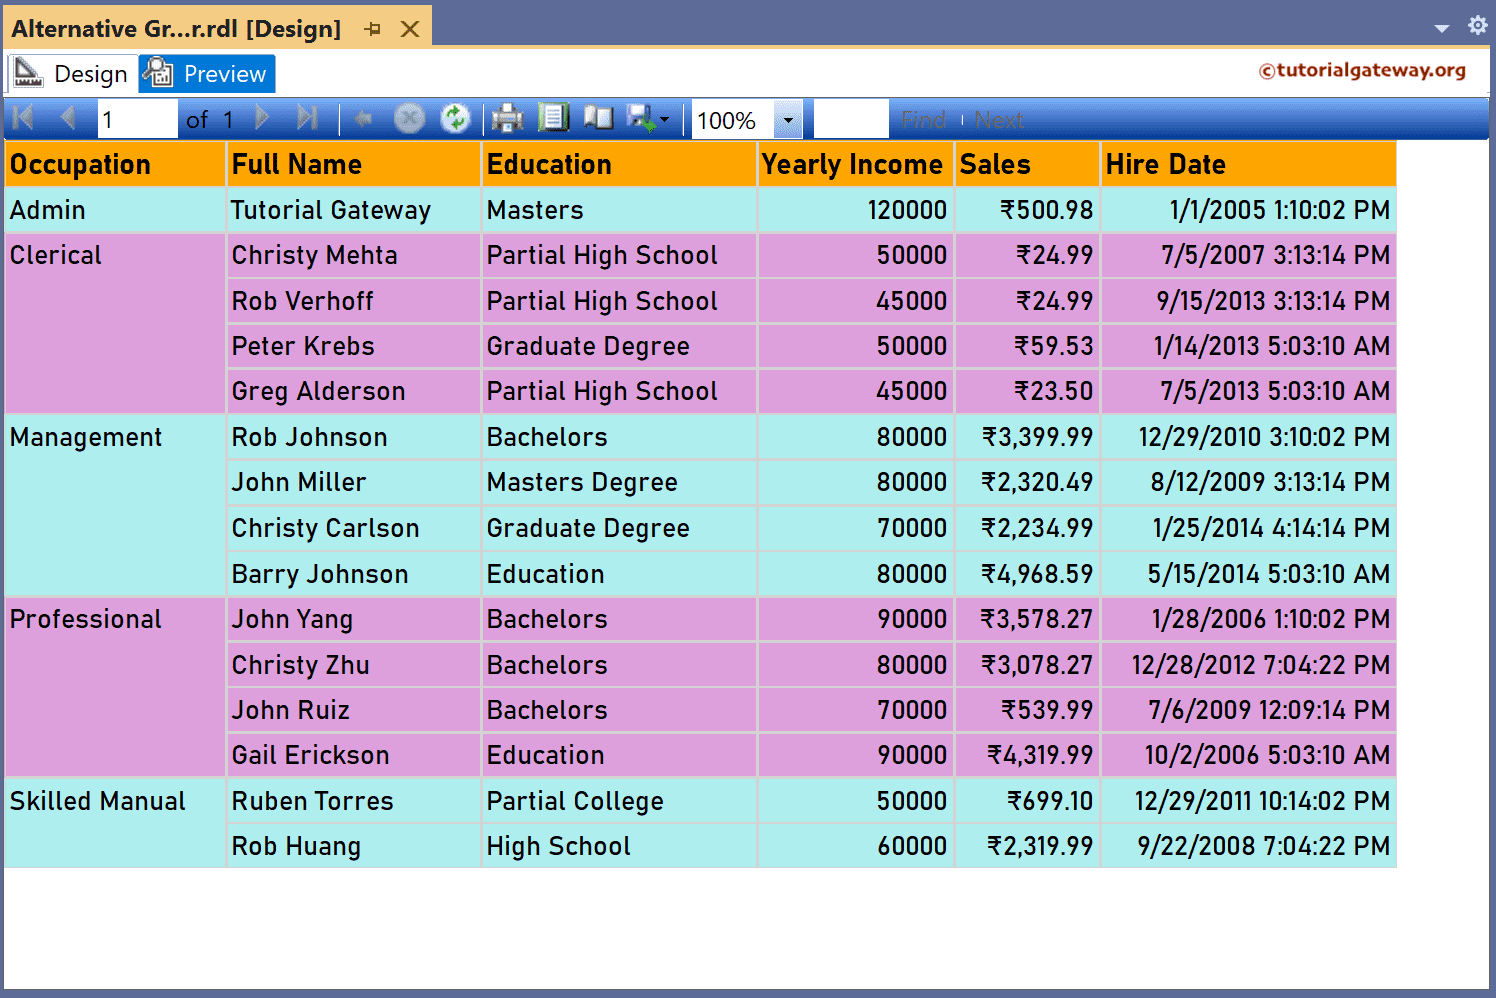
Click OK to close the Expression window. If you observe the report review, each group has two different or alternative background colors.
Let me change the Add Alternative Background Colors to Table Group rows expression to the below one.
=IIF(RunningValue(Fields!Occupation.Value, CountDistinct, "DataSet1") MOD 2 = 1, "PaleTurquoise", "Plum")
Preview the report.