This article shows how to perform the Tableau YTD table calculations with an example. We can also call it the year to date table calculations.
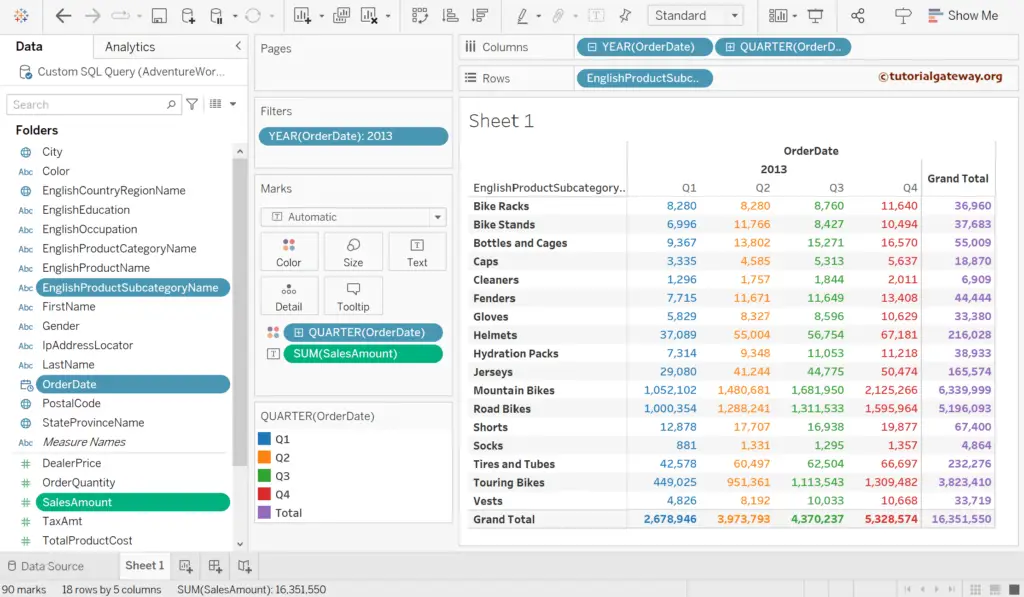
To explain then Tableau YTD Table Calculations, drag and drop the Order Date into the Columns Shelf and expand the Hierarchy to display the Quarterly Sales. Next, add the English product Subcategory name to the Rows shelf and the Sales Amount to Text Shelf.
Add Order Date to the Filters section and uncheck 2010, 2011, 2012, and 2014. Next, select and drop the Quarter from Columns to Color Shelf using the Control button. Then, use Analysis Menu to add Row and Column Totals.
How to Perform the Tableau YTD Table Calculations?
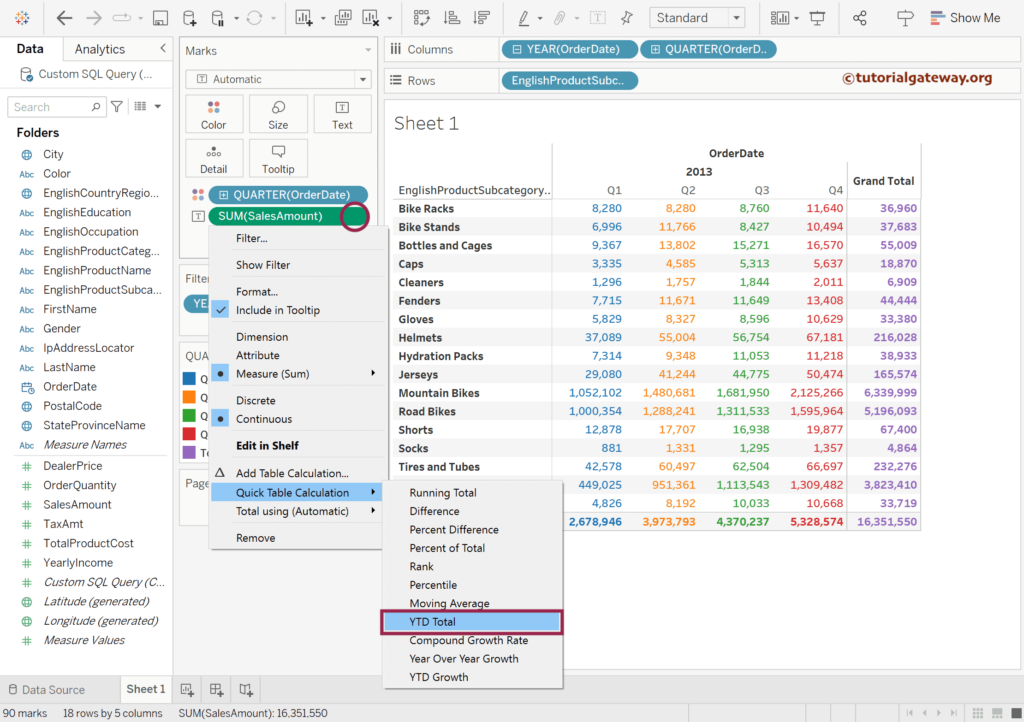
Under the Marks shelf, click the down arrow beside the Sum of Sales Amount, click Quick Table Calculation, and then select the YTD total.
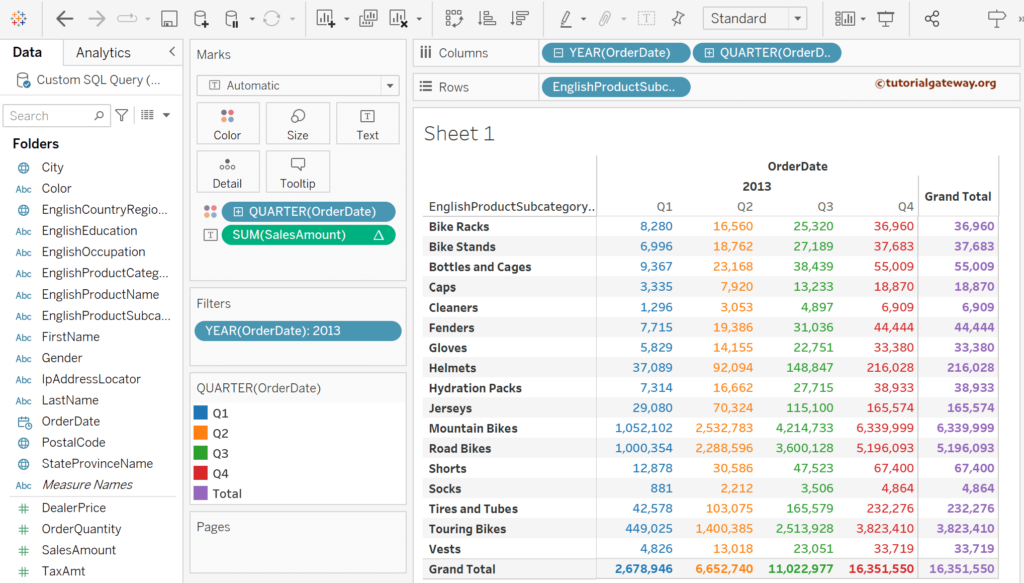
It calculates the Year to date total for each quarter.
- Bike Racks
- Q1 = 8,280
- Q2 = 8,280 (Q1) + 8,280 (Q2)
- Q3 = 8,280 (Q1) + 8,280 (Q2) + 8,760 (Q3)
- Q3 = 8,280 (Q1) + 8,280 (Q2) + 8,760 (Q3) + 11,640 (Q4)
Let me change the Tableau YTD calculation computing from Table (across) to Table(Down). It calculates the YTD for each quarter. For Q1
- Bike Racks = 8,280
- Bike Stands = 8,280 + 6,996
- Bottles and Cages = 8,280 + 6,996 + 9,367
- Caps = 8,280 + 6,996 + 9,367 + 3,335
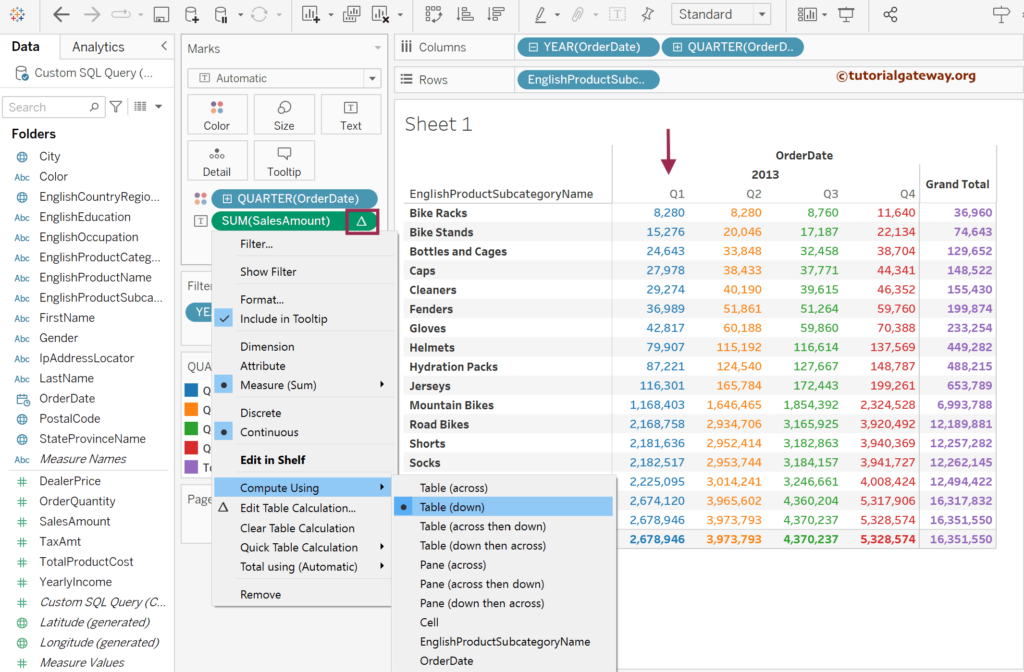
If we change it to Table across and then down, it goes continuously from Bike racks Q1 to Q4 and the following product subcategory. For instance,
Bike Stands = 36,960 + 6,996
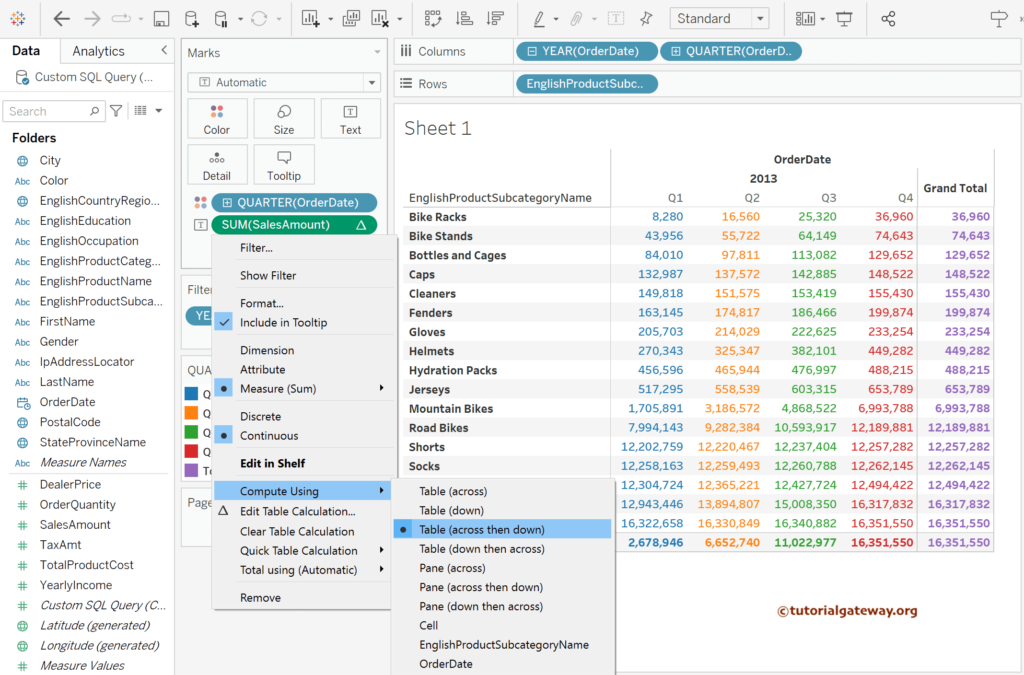
Tableau YTD Table Calculations Example 2
Let me replace the Product Subcategory from the Rows shelf with the English Country Region Name. Next, add the Color group to the Row Shelf. Within the Color group
Multi = Multi, NA, Red, and White Color.
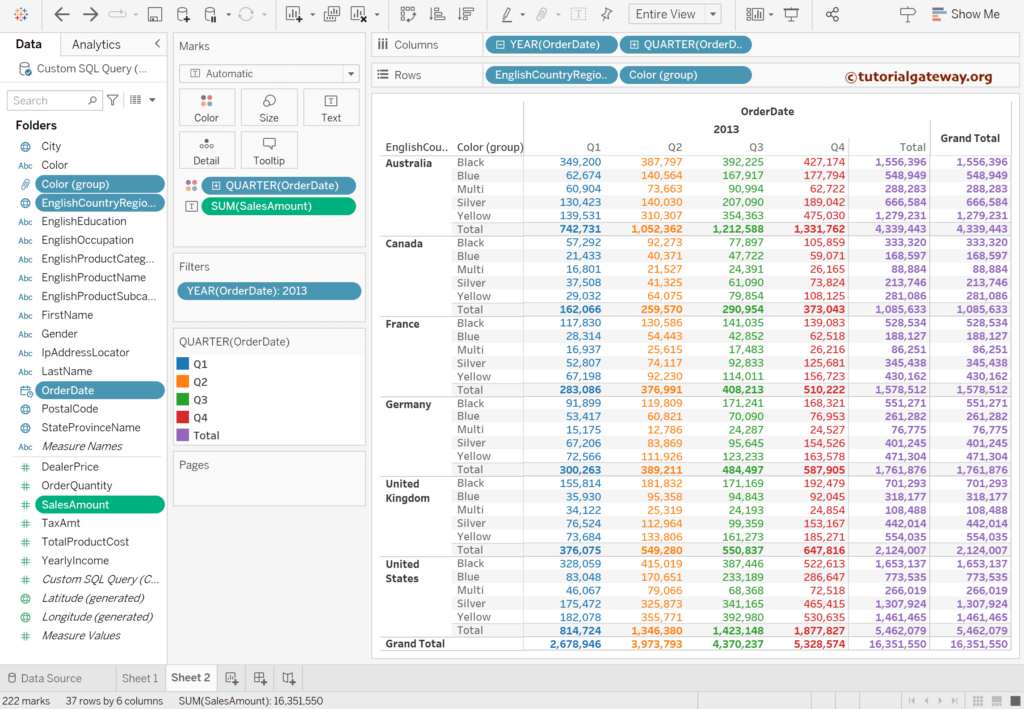
Let me choose the Quick Table Calculation as the YTD total.
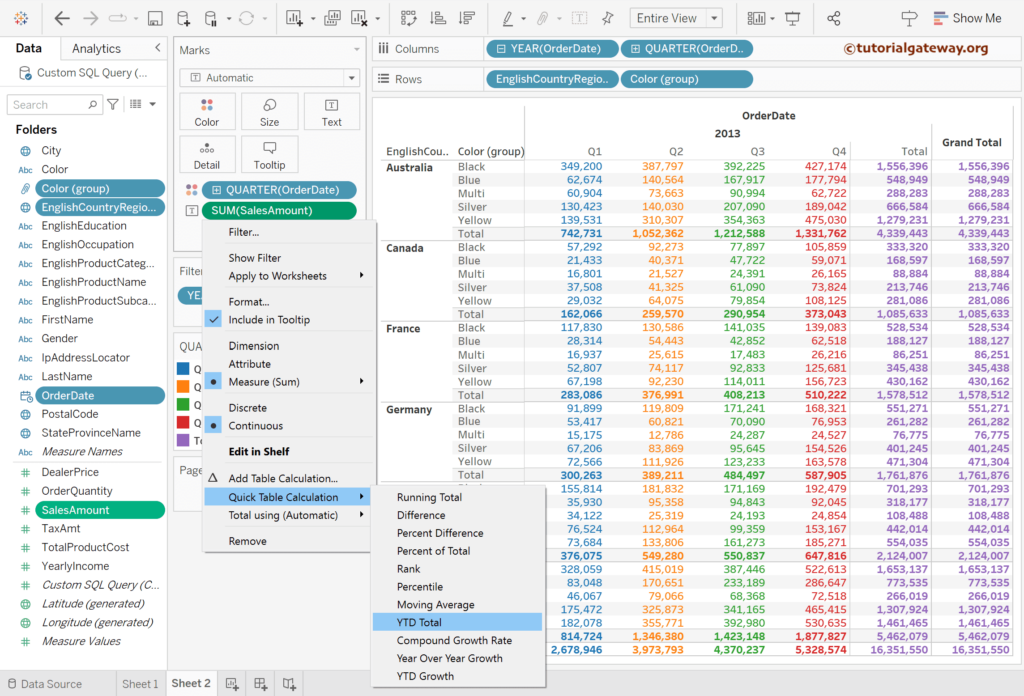
Now, you can see the multi-level year to date table calculations.
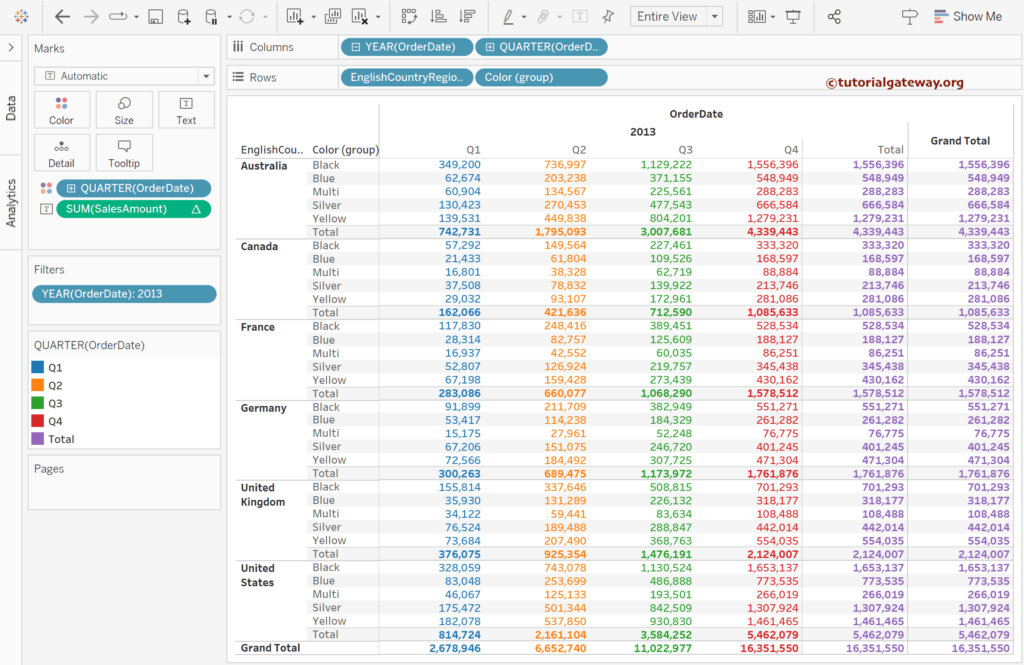
Change the computing to table(down). It calculates the YTD total for each quarter irrespective of Color group and Country.
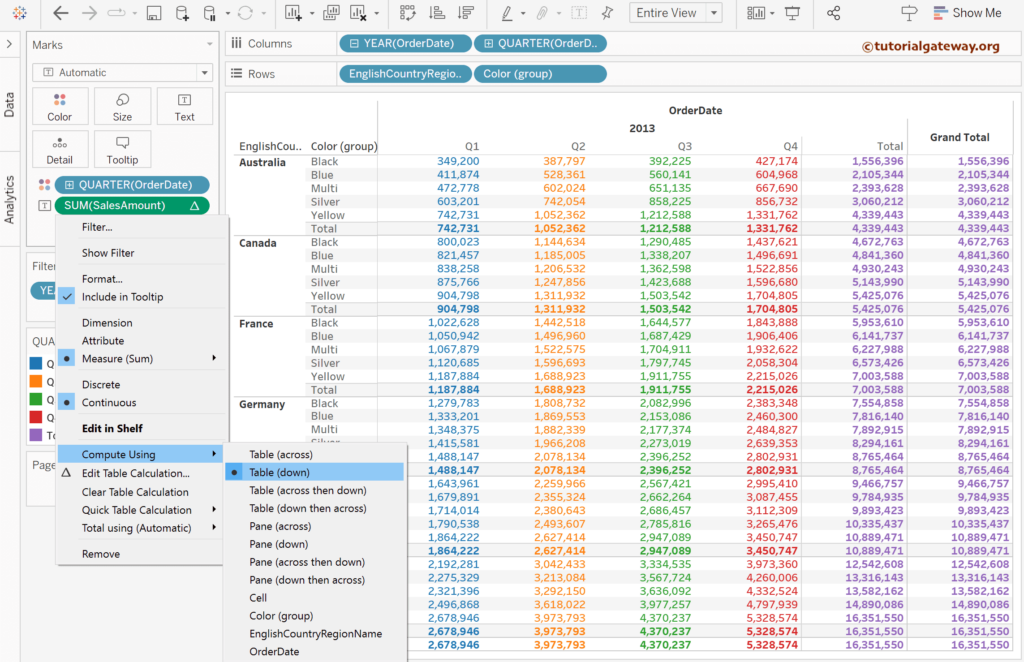
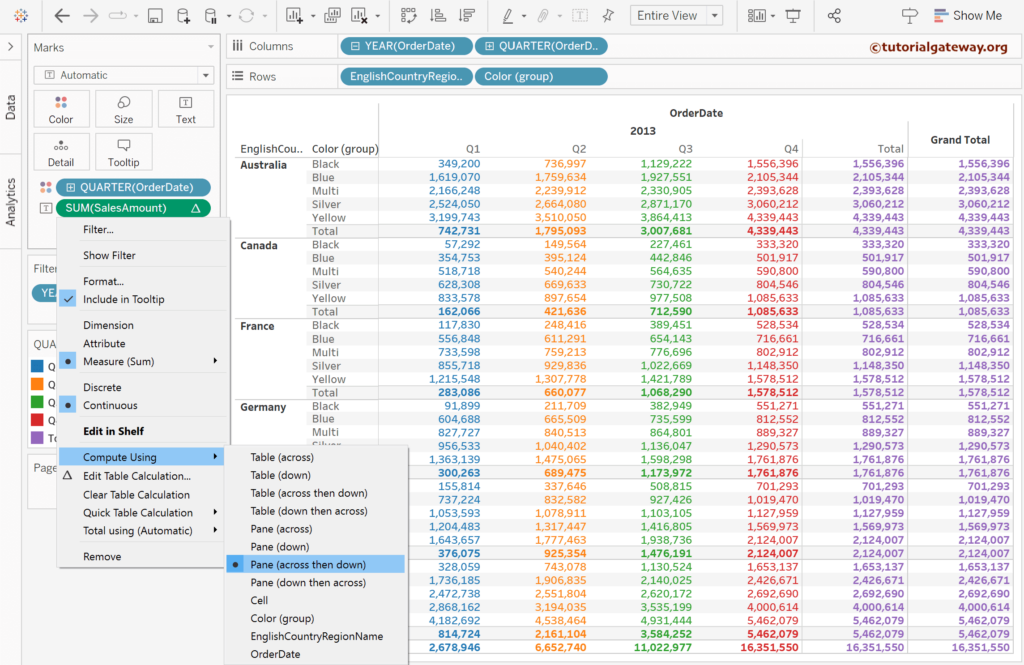
Pane across then down: Tableau calculates the YTD total for each Country in a table. For Australia, it starts with Black color and calculates the total of all quarters, then goes to Blue color, and so on, up to the fourth quarter of the Yellow color. It again restarts for Canada.
