A Stem and Leaf Diagram, also called Stem and Leaf plot in R, is a special table where each numeric value is split into a stem (First digit(s) ) and a leaf (last Digit). For example, 57 split into 5 as stem and 7 as leaf. In this article, we show you how to make a Stem and Leaf plot with examples.
Syntax
The basic syntax to draw the Stem and Leaf chart or plot in R Programming is as shown below.
stem(x, scale = 1, width = 80, atom = 1e-08)
The following is the list of arguments supported by the Stem and Leaf chart in this programming language:
- x: Please specify the data on which you want to draw the Stem and Leaf Plot. Here, you have to use the numeric vector or a list containing the numeric vector.
- scale: Please specify the scale you want to use for your plot.
- width: It is optional, but you can use this to specify the desired width of a plot. By default, it is 80.
- atom: It is tolerance.
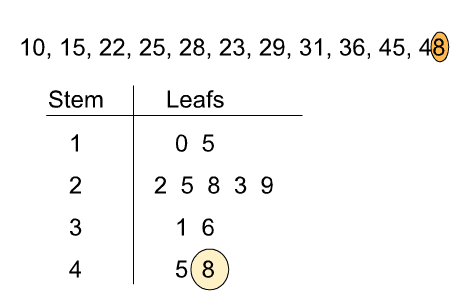
Before we get into the example, let us see the diagrammatic representation of the Stem and Leaf plot. From the below screenshot, you can see that first, we declared variables 10, 15, 22, 25, 28, 23, 29, 31, 36, 45, 48. From those values, the First digit is assigned to the stem, and the last Digit is a leaf.
Create a Stem and Leaf Plot in R Programming
In this example, we show how to make a Stem and Leaf plot using the ChickWeight data set, which is provided by the RStudio. If you require to import data from external files, then I suggest you to refer the R Read CSV article to understand the importing of the CSV file in R Programming.
ChickWeight

# Drawing Stem and Leaf Plot
stem(ChickWeight$weight)
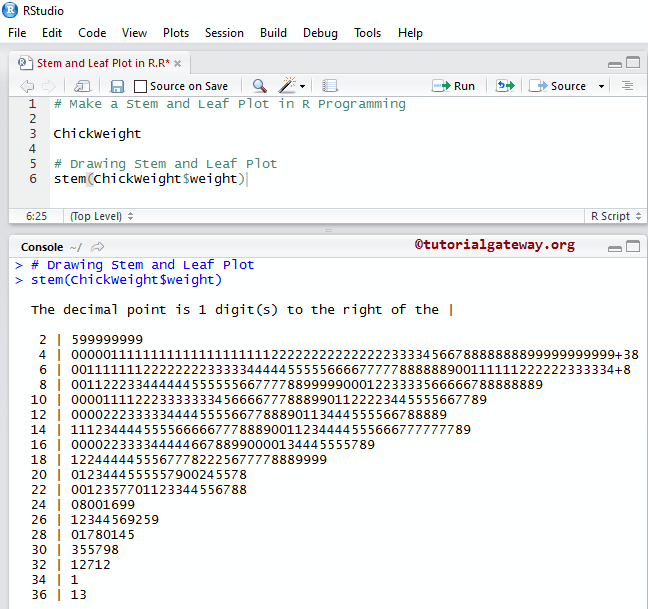
ChickWeight data set returns the output as a List. So, we are using the $ to extract the data from List.
stem(ChickWeight$weight)
From the above screenshot, you can see that the ChickWeight data set has numbers like 25, 29, 29, ……., 341, 361, 363.
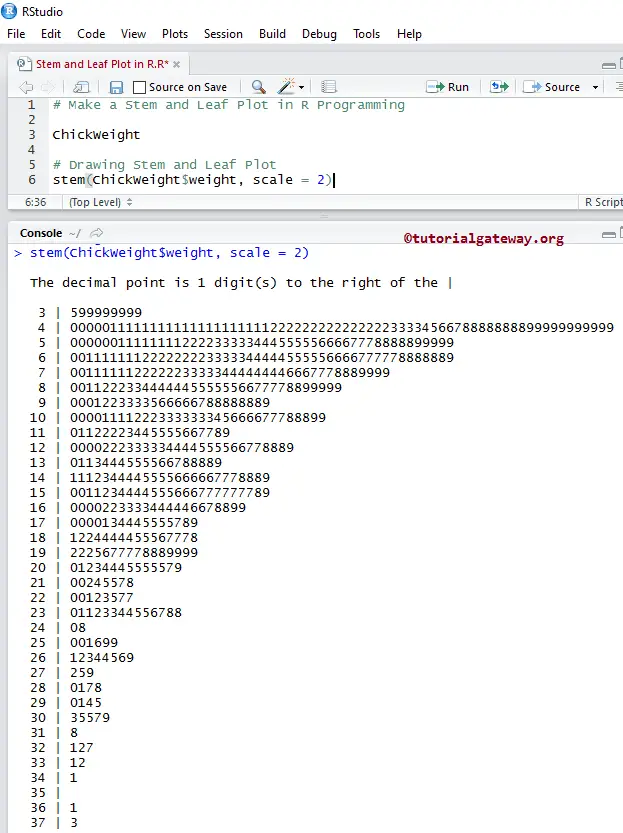
Use Scale for Stem and Leaf Plot
In this stem and leaf plot example, we show how to use the scale argument inside the stem function.
ChickWeight

# Drawing Stem and Leaf Plot
stem(ChickWeight$weight, scale = 2)
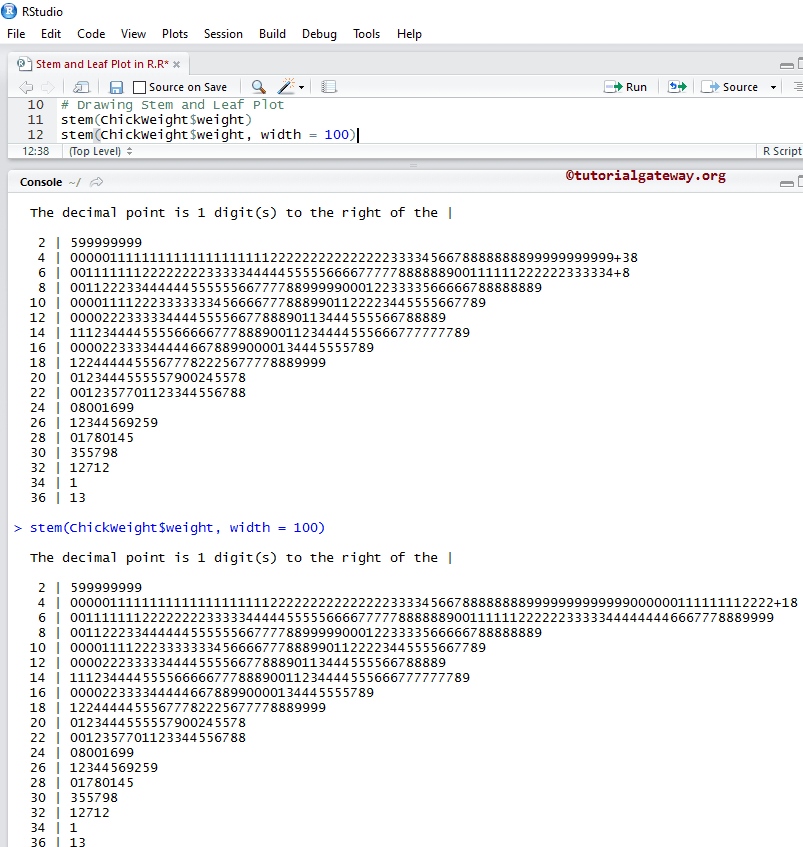
Change the width of a Stem and Leaf Plot
In this example, we change the width of a Stem and Leaf chart in this Programming.
ChickWeight

# Drawing Stem and Leaf Plot
stem(ChickWeight$weight)
stem(ChickWeight$weight, width = 100)