The R ggplot2 package is useful to plot different types of charts and graphs, but it is also essential to save those charts. To save the graphs, we can use the traditional approach (using the export option) or the ggsave function provided by the ggplot2 package. Let us see how to Save the plots drawn by ggplot using the R ggsave function and the export option with an example.
The syntax to save the ggsave in Programming is
ggsave(filename)
and the complex syntax behind this is:
ggsave(filename, plot = last_plot(), device = NULL, path = NULL,
       scale = 1, width = NA, height = NA, dpi = 300, limitsize = TRUE, ..,
       units = c("in", "cm", "mm"))
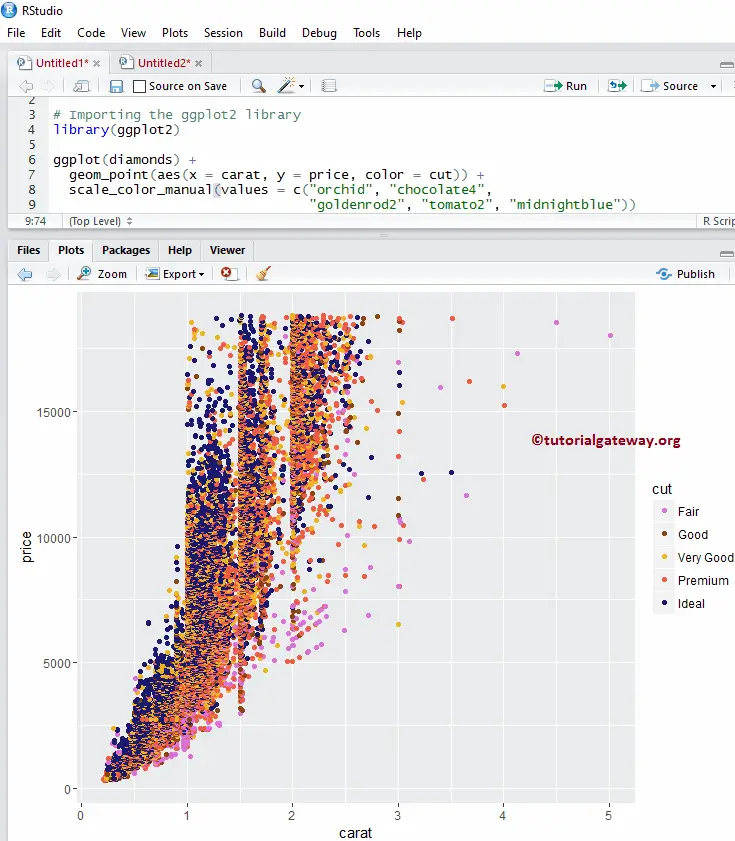
Create R ggplot Scatter plot
In this example, we draw a scatter plot, and we are going to save this scatter plot. I suggest you refer ggplot2 Scatter Plot article to understand plotting the scatter plot.
TIP: ggplot2 package not installed by default. Please refer Install Packages article to install the R Programming packages.
# Importing the ggplot2 library
library(ggplot2)

ggplot(diamonds) +
  geom_point(aes(x = carat, y = price, color = cut)) +
  scale_color_manual(values = c("orchid", "chocolate4",
                                "goldenrod2", "tomato2", "midnightblue"))
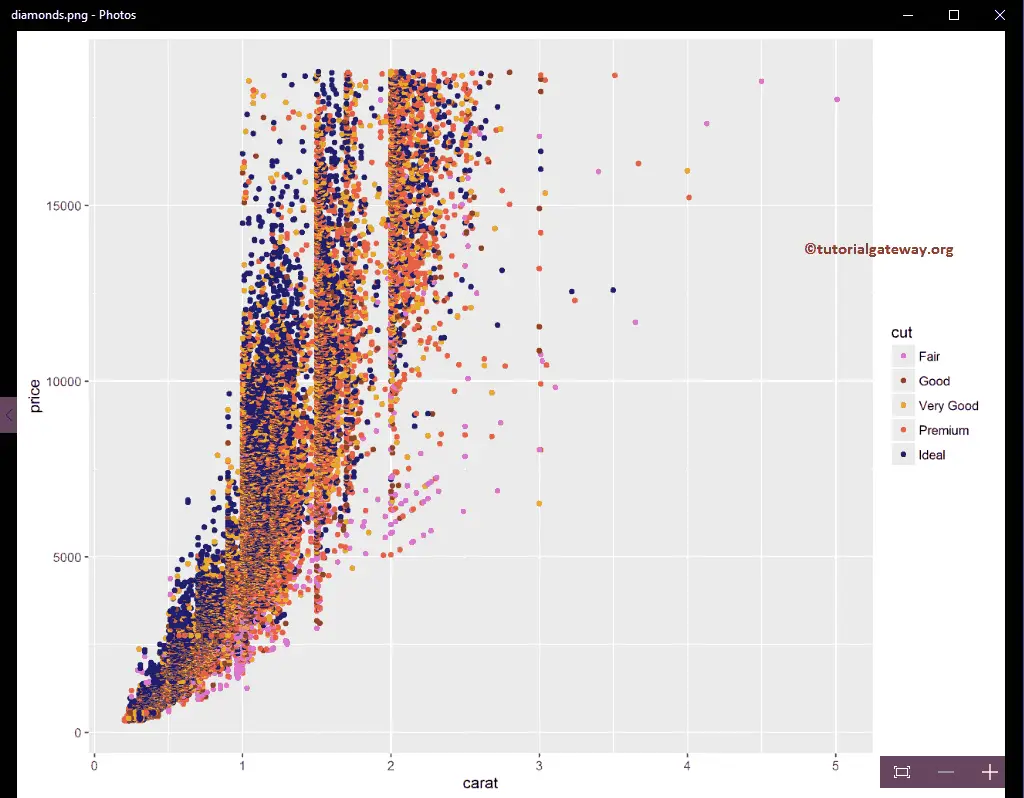
Save R ggplot as PNG using ggsave
Let us see how to save the ggplot as the png image using the ggplot2 ggsave function.
# Importing the library
library(ggplot2)

ggplot(diamonds) +
  geom_point(aes(x = carat, y = price, color = cut)) +
  scale_color_manual(values = c("orchid", "chocolate4",
                                "goldenrod2", "tomato2", "midnightblue"))
# To save as png
ggsave("diamonds.png")
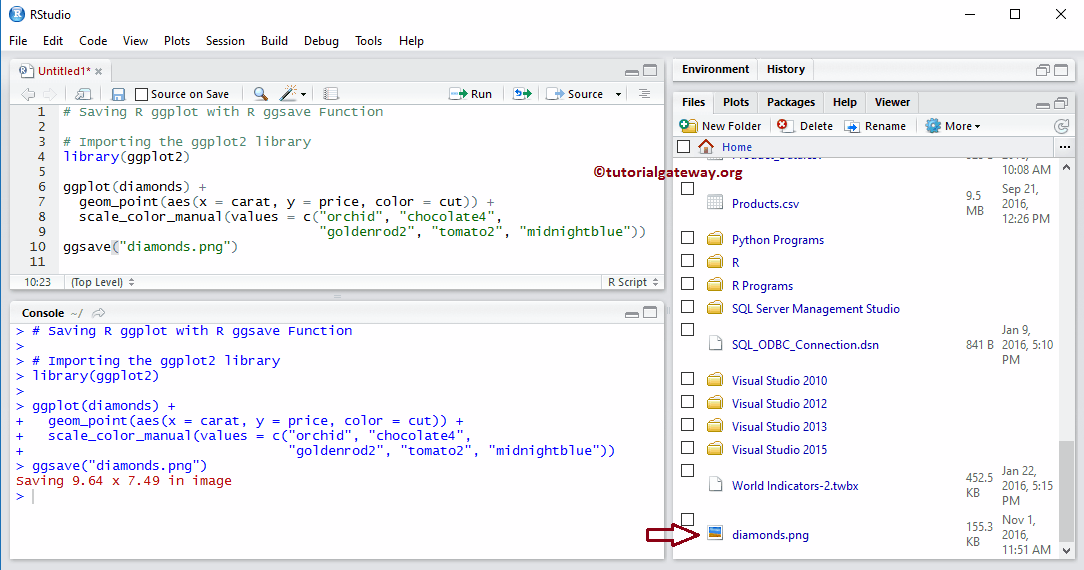
Let us open the diamonds.png file and see
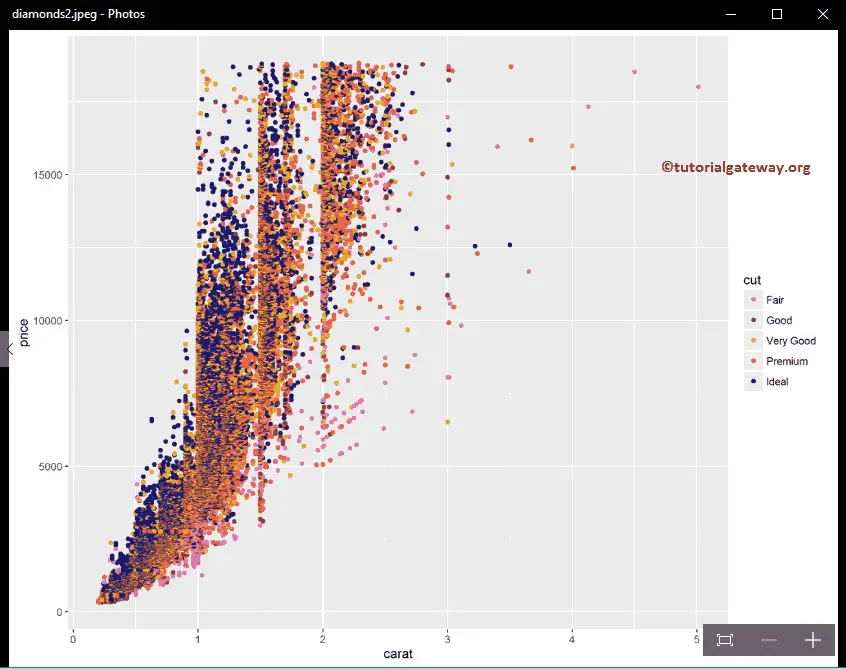
Save R ggplot as JPEG using ggsave
In this example, we show how to save the ggplot as the jpeg image using the ggplot2 ggsave function.
# Importing the library
library(ggplot2)

ggplot(diamonds) +
  geom_point(aes(x = carat, y = price, color = cut)) +
  scale_color_manual(values = c("orchid", "chocolate4",
                                "goldenrod2", "tomato2", "midnightblue"))
# saving the scatterplot as jpeg
ggsave("diamonds2.jpeg")

Let us open the diamonds2.jpeg file and see
Save R ggplot as PDF using ggsave
This example shows how to save the ggplot as the pdf file using the ggplot2 ggsave function.
# Importing the library
library(ggplot2)
ggplot(diamonds) +
geom_point(aes(x = carat, y = price, color = cut)) +
scale_color_manual(values = c("orchid", "chocolate4",
"goldenrod2", "tomato2", "midnightblue"))
# Saving as pdf
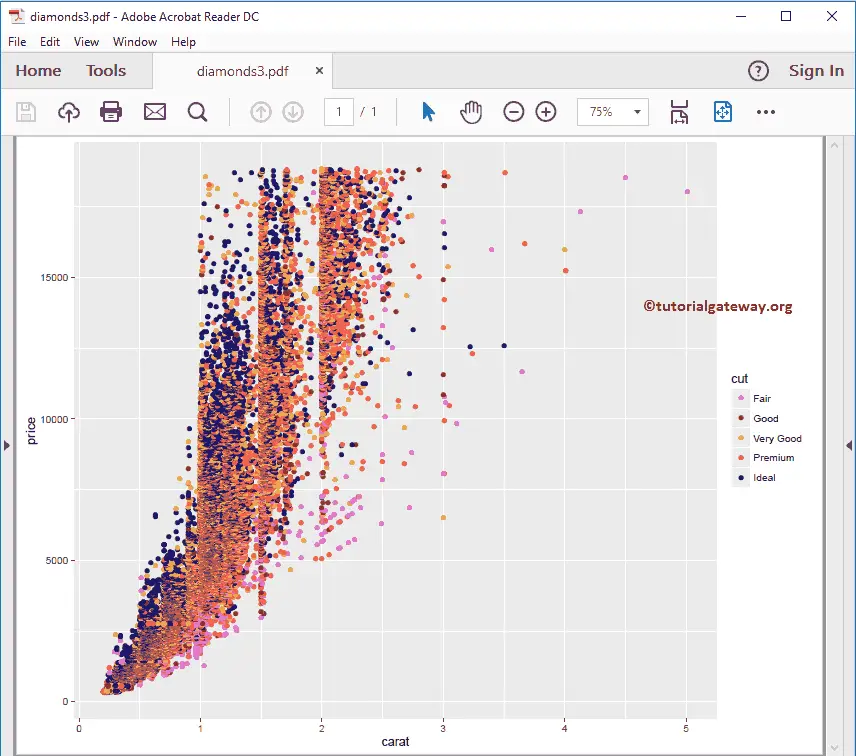
ggsave("diamonds3.pdf")

Let us open the diamonds.pdf file and see
Save R ggplot with width & Height using ggsave
The ggsave function also allows us to specify the width and height of the image using the width and Height parameters.
# Importing the ggplot2 library
library(ggplot2)
ggplot(diamonds) +
geom_point(aes(x = carat, y = price, color = cut)) +
scale_color_manual(values = c("orchid", "chocolate4",
"goldenrod2", "tomato2",
"midnightblue"))
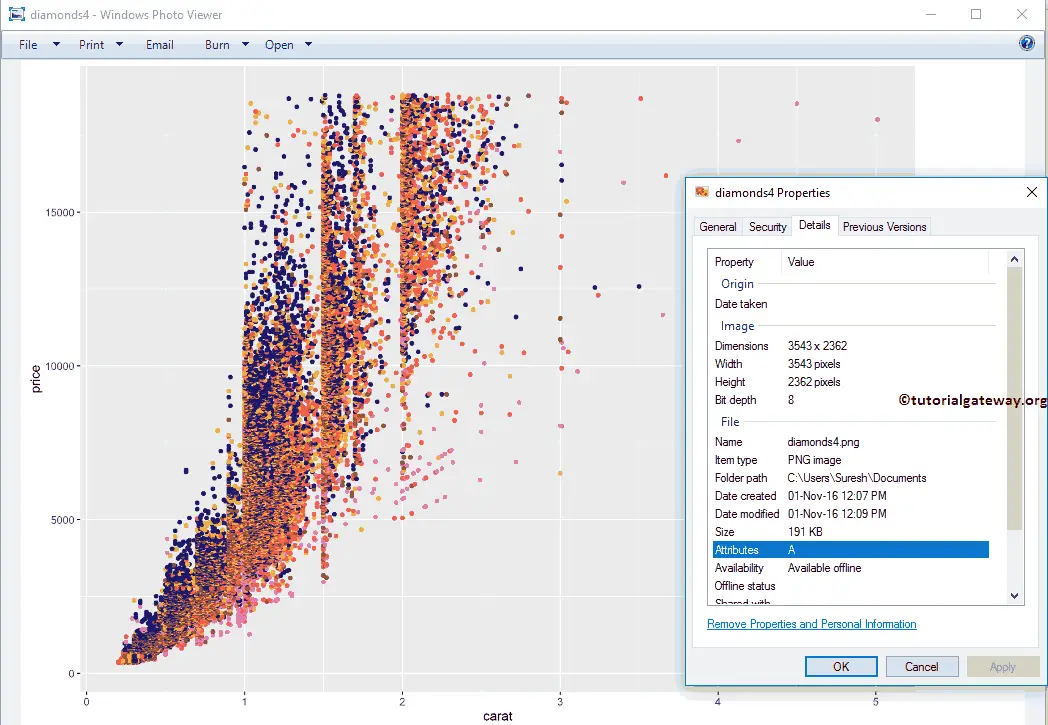
ggsave("diamonds4.png",
width = 30, height = 20, units = "cm")

Let us open the diamonds4.png file and see
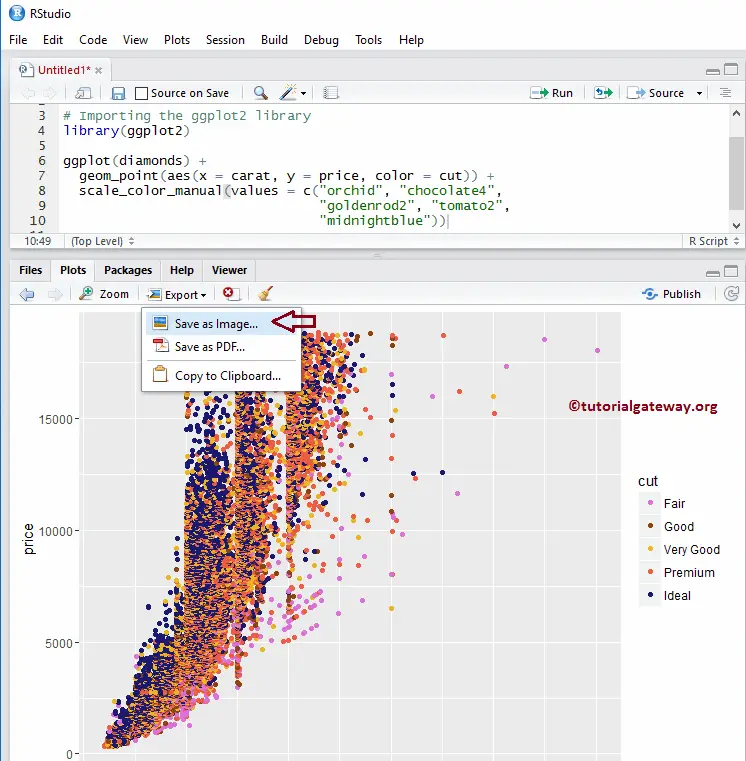
Save ggplot as Image using Export
Let us see how to save the ggplot using the traditional approach. First, go to the Export option under the plot tab, and select the Save as Image.. option.
Once you select the Save as Image.. option, a new window called Save Plot as Image open; please select the image format you wish to save.
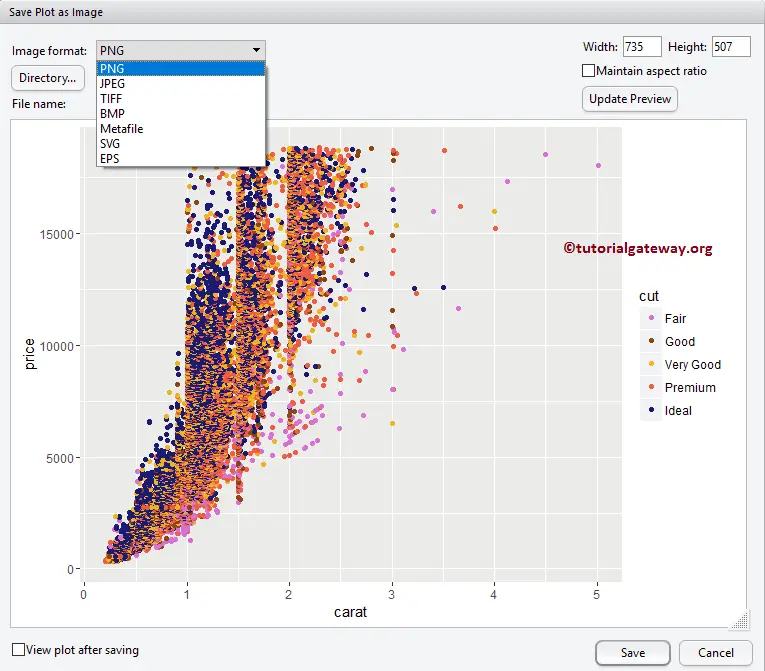
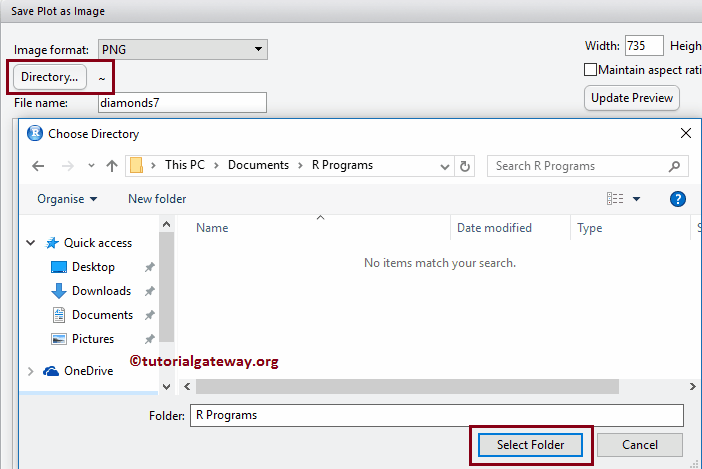
Next, click on the Directory button to choose the file directory or the location you want to save the image. From the below screenshot, you can observe that we are selecting the R Programs folder.
Next, you can change the Width and Height of an image.
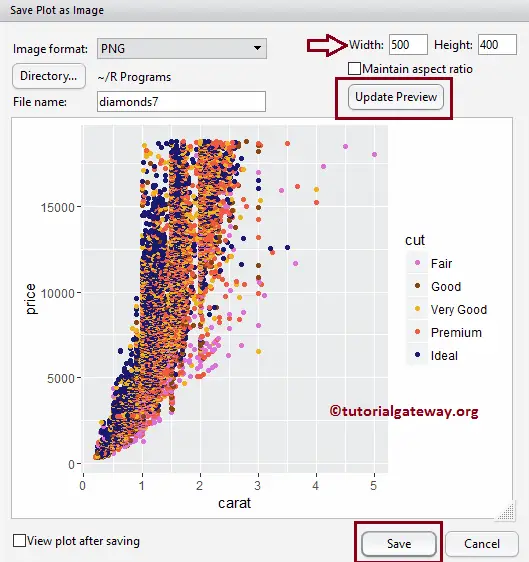
Once you finish the setting, click the Save button to save the image in the respective format.
Save R ggplot as PDF using Export
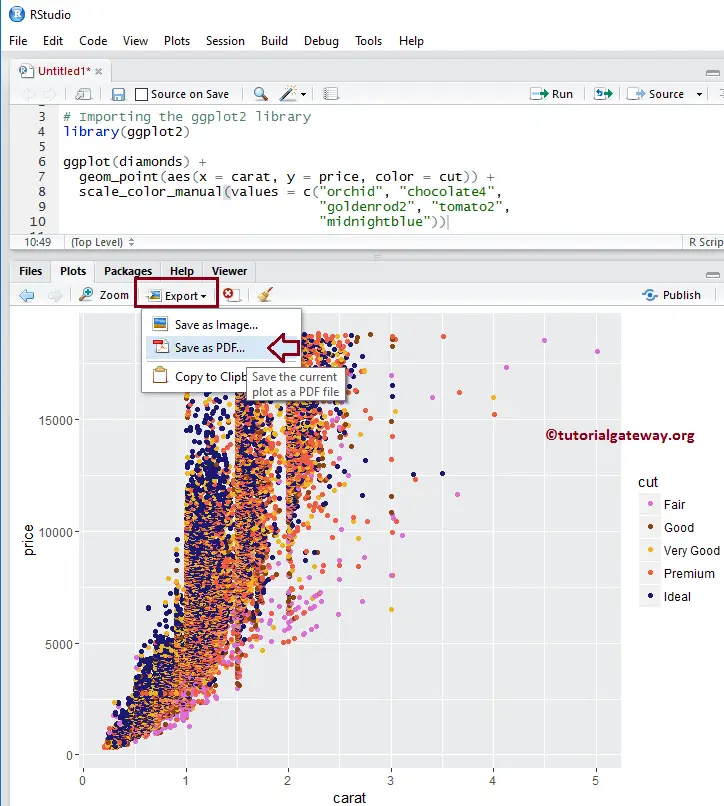
This example shows how to save the ggplot as a pdf using the traditional approach. For this, go to the Export option under the plot tab, and select the Save as PDF.. option.
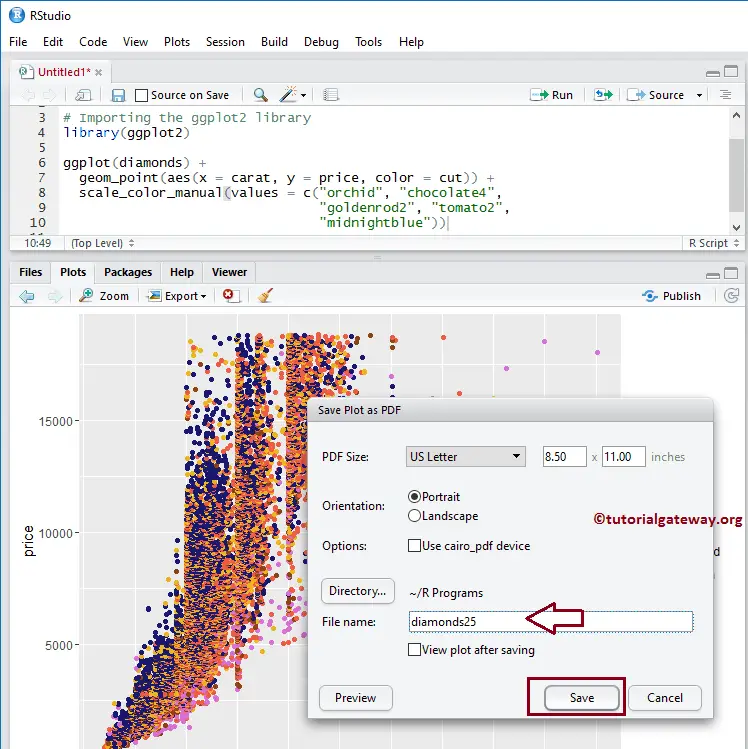
Once you select the Save as PDF.. option, a new window called Save Plot as PDF opens. Please select the directory and change the pdf file name.
From the screenshot below, see the newly saved png and pdf files.