This article will show you how to format the Tableau Chart Title with particle examples. We will use the data source we created earlier to demonstrate these formatting chart title options on the desktop.
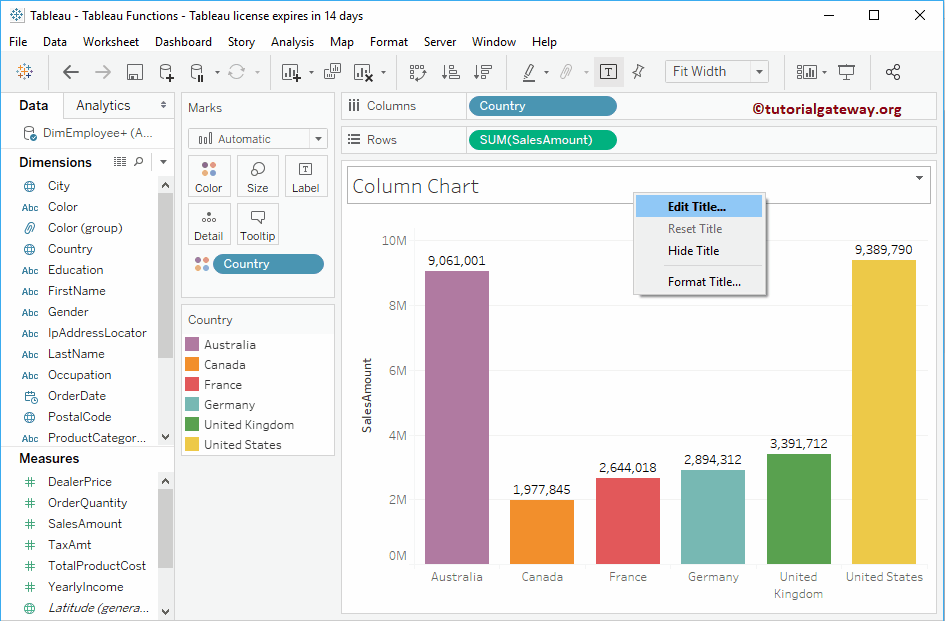
From the below screenshot, you can see we created a Column chart by dragging the Country Dimension to the Columns Shelf, the Sales Amount to the Row Shelf, and the Country dimension to the Color Shelf.
Please visit the Data Labels in Reports article to know the data source.
Format Tableau Chart Title
To format the chart title, Right-click on the report title, which will show you the context menu. Please select the Edit Title option to make changes to the Title. For more Charts >> Click Here.
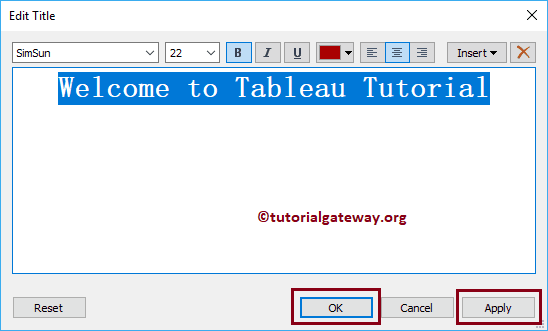
Selecting the Edit Title option will show you the following window. By default, Tableau will display the Sheet name as the chart title.
First, we changed the Chart to Welcome to Tableau Tutorial. Next, we changed the Font style to SimSum, Font size to 22, Font weight to Bold, text alignment to Center, and font color to Red.
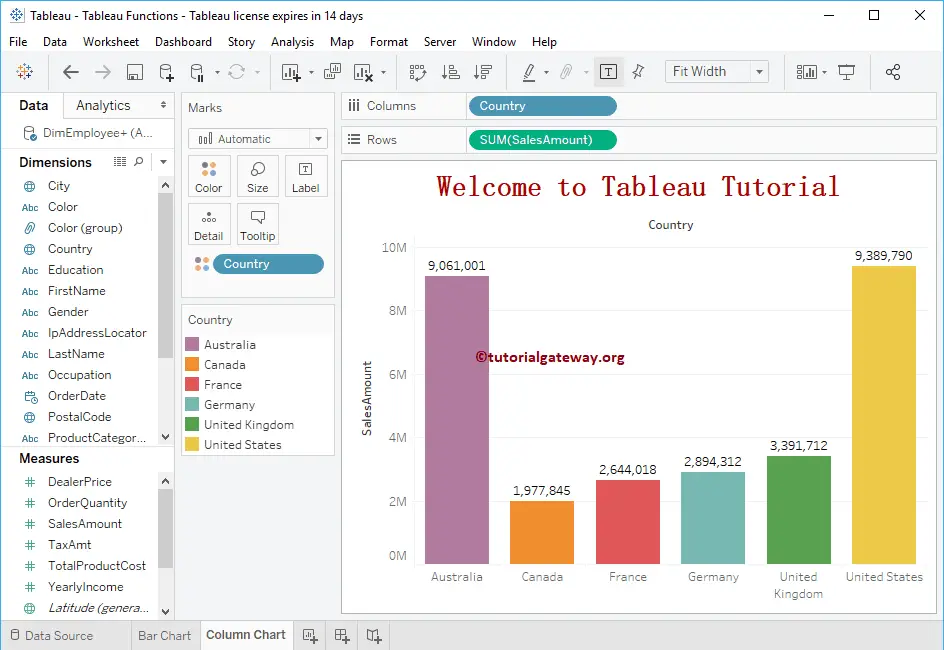
Now you can see the formatted Tableau Chart Title, which is a neat and clean title.
Next, right-click on the title, and this time, select the Format Title option.
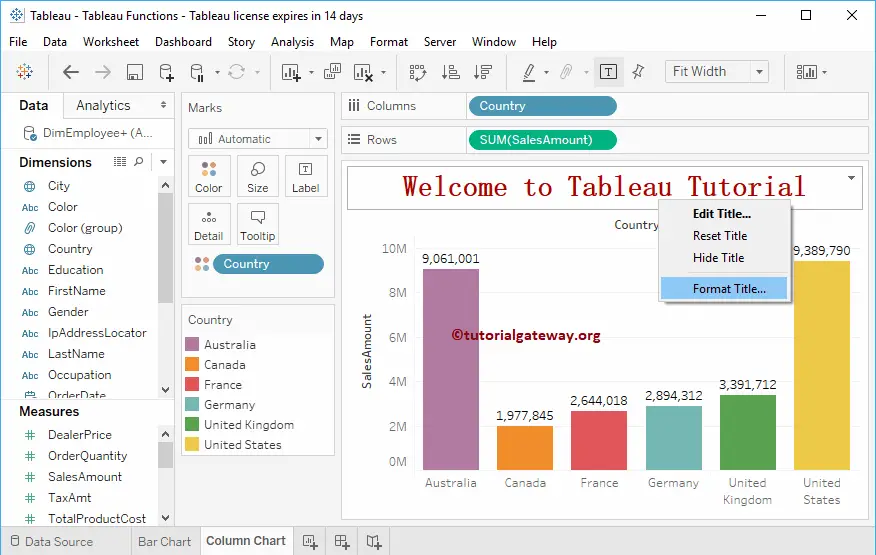
It will open the Format Title and Caption window. Use this tab to add the shading and border colors to the title and the caption. For demonstration purposes, let me add the background color and the border lines to the title.
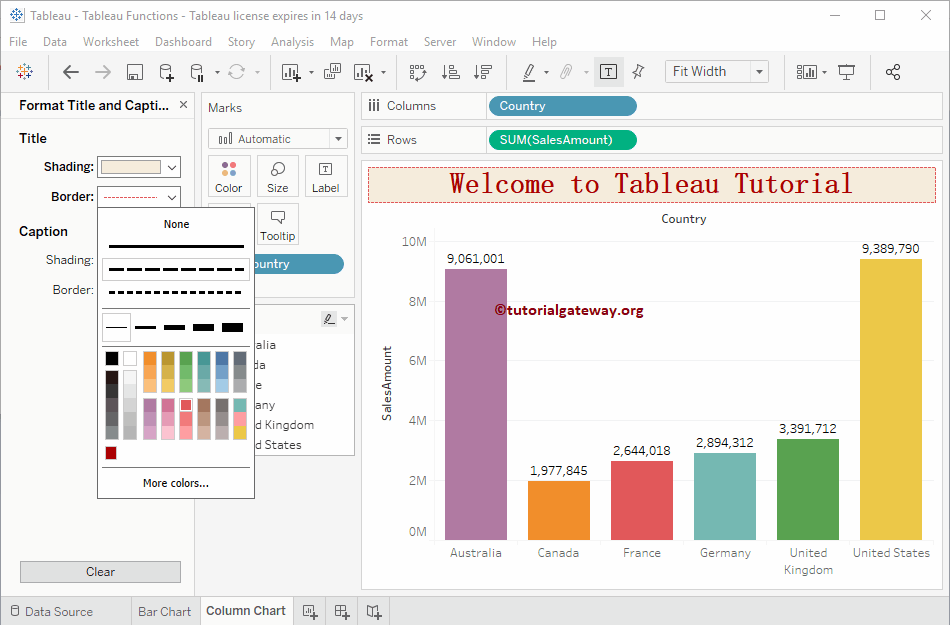
You can also access these formatting options by clicking the Tableau Format menu and selecting the Title and Caption submenu. It will show the formatted chart title window as shown in the above screenshot.