In real-time, we mostly use the Data Bars in Matrix reports. In this article, we will show you how to create and configure the Data Bars in SSRS Matrix Reports.
TIP: Please refer to Data Bars article to understand the configuration of Data Bars in SSRS Table Reports with an example.
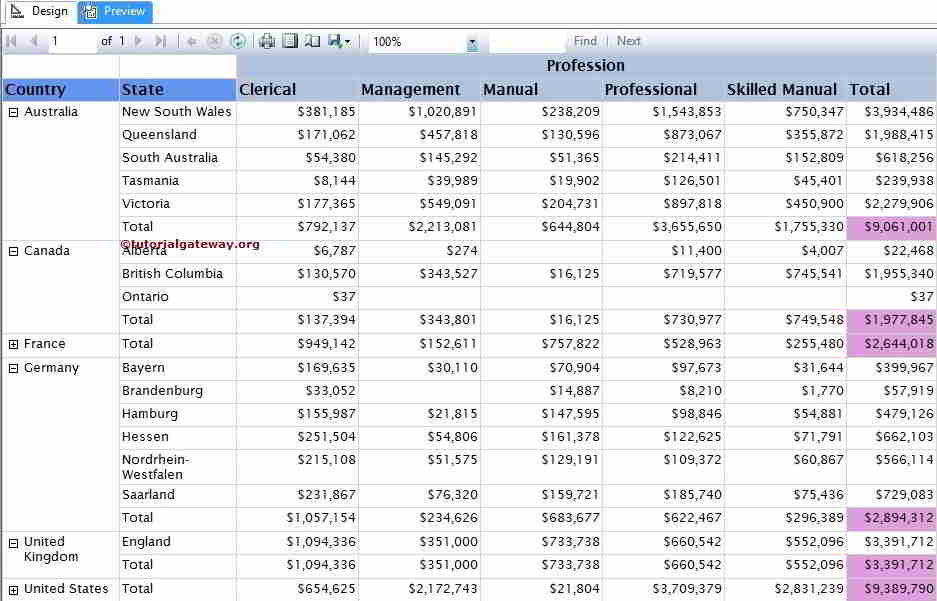
We are going to use the below-shown matrix report to configure the Data Bars. Please refer Matrix Report, Data Source and Dataset articles to understand the creation of Data Source, Dataset and Matrix report.
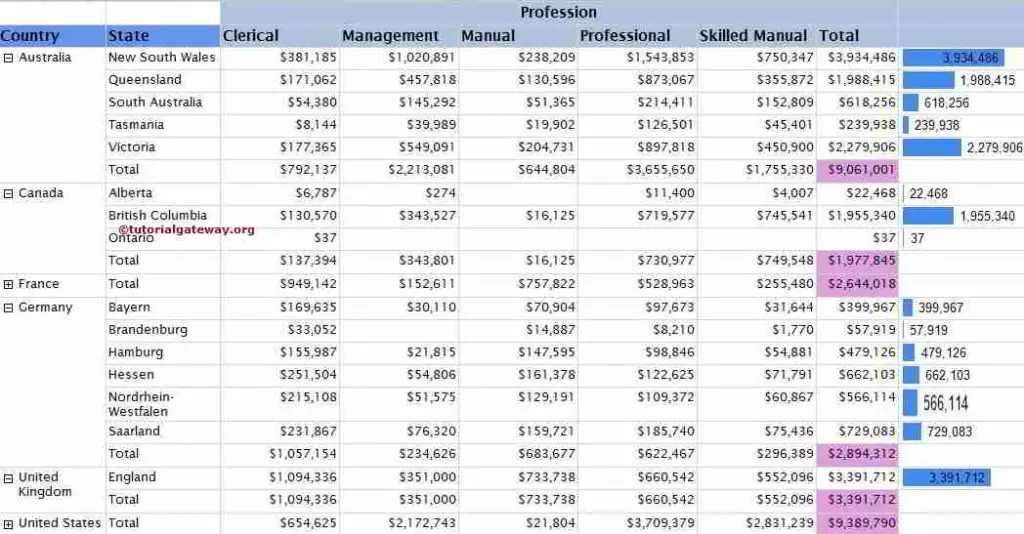
If you observe the below screenshot, It was a Drill Down Matrix report with Row Total, Column Total, and Grand Total (Pink Color Column) columns.
SQL Command we used as the Dataset is:
SELECT Geo.[EnglishCountryRegionName] AS [Country]
      ,Geo.[StateProvinceName] AS [State]
      ,Geo.[City]
      ,Cust.FirstName +' '+ Cust.LastName AS [Full Name]
      ,Cust.EnglishEducation AS Education
      ,Cust.EnglishOccupation AS Occupation
      ,Cust.[Gender]
      ,SUM(Cust.YearlyIncome) AS YearlyIncome
      ,SUM(Fact.SalesAmount)AS SalesAmount
FROM  DimCustomer AS Cust
  INNER JOIN
      FactInternetSales AS Fact ON
   Cust.CustomerKey = Fact.CustomerKey
  INNER JOIN
     [DimGeography] AS Geo ON
   Cust.GeographyKey = Geo.GeographyKey
 GROUP BY Geo.[EnglishCountryRegionName]
         ,Geo.[StateProvinceName]
	 ,Geo.[City]
	 ,Cust.FirstName
         ,Cust.LastName
         ,Cust.EnglishEducation
         ,Cust.EnglishOccupation
	 ,[Gender]
  ORDER BY [Country]
Data Bars in SSRS Matrix Reports
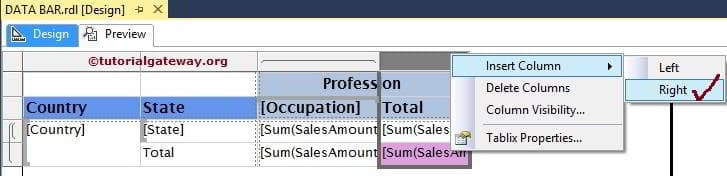
In this example, We will create and add the Data Bar on the right-hand side of the Total Column. First, let us create an Empty column by right-clicking on the Total column and select the Insert Column option and then select the Right option.
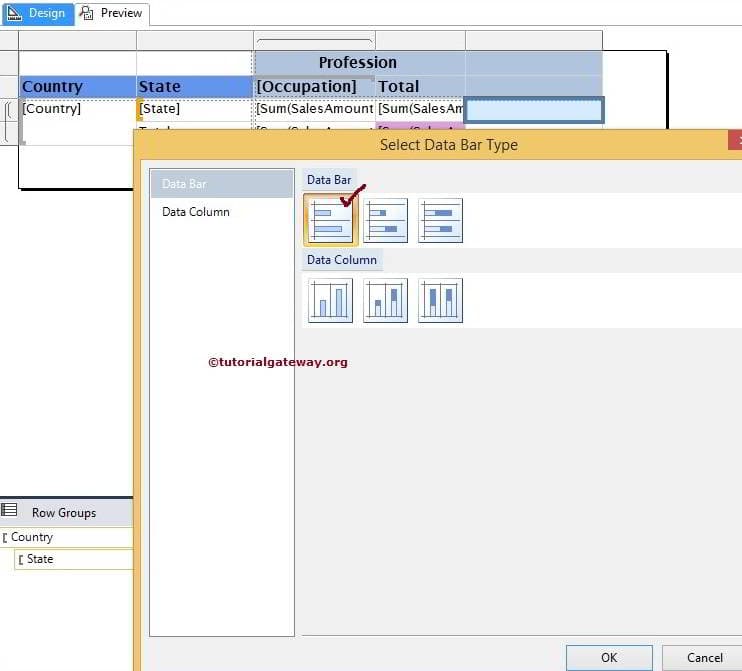
Now, Drag and drop the Data Bars from Toolbox to the Empty column. When you drag the Data Bars to an Empty column, a new window called Select Data Bar Type will be opened to select the required Data Bar or Data Column from the available once. In this Data Bars in SSRS Matrix example, we are selecting Simple Data Bar, as shown in the below screenshot.
NOTE: Please be careful while adding Data Bars in Matrix Report. If you place the Data Bars at Total Row, then Reporting Server will display the data bar for Totals, not for States.
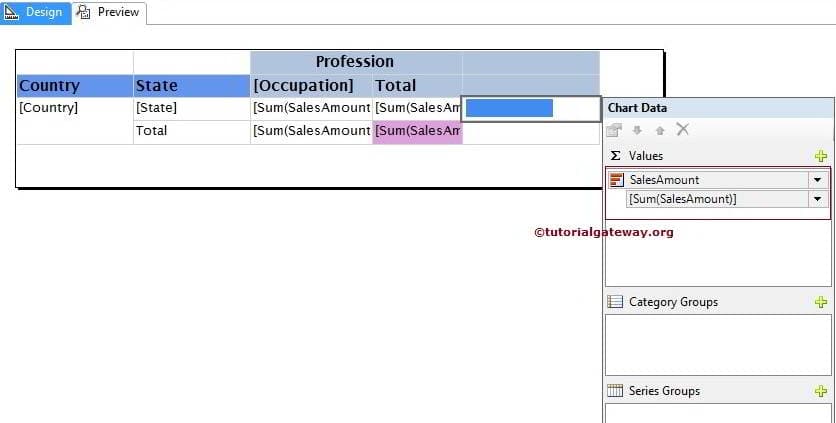
Click Ok to add Data Bars toa newly created empty cell. Now, we have to configure the values of Data Bars. First, click on the Blue bar from the below screenshot will open the Chart Data window.
In this example, we want to show the Sales Amount in Data Bars. So, please drag and drop or select the Sales Amount as the Chart Value.
Click on the Preview button to see the report Data Bars in SSRS Matrix preview.
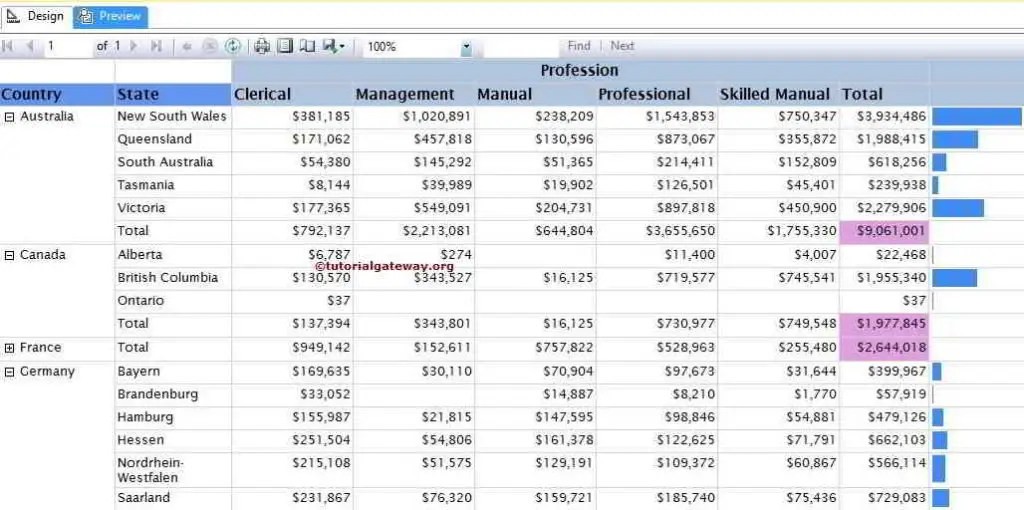
If you observe the above screenshot, It is providing a perfect result. However, we are unable to identify the value represented by the Data Bar (Sales Amount in each state). To resolve these situations, We have to use the Data Labels.
First, Right-click on the Blue bars. Next, select the Show Data Labels option from the context menu to show the values.
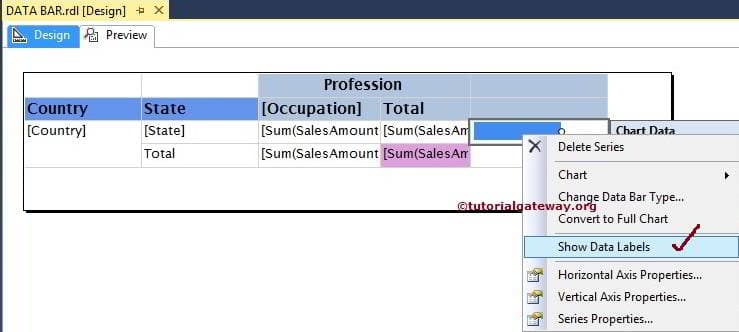
Here, we Formatted the Numbers produced by the Data labels. Let’s click on the Preview tab to see the Report preview.