In this article, we will show you how to add Reference Lines in Tableau with an example. We will write the Custom Query against the SQL Server Data Source for this Tableau Reference Lines demo.
Please visit the Connecting to Server article to understand the Tableau configurations. The custom SQL query we are going to use for this Reference Lines in Tableau report is:
SELECT ProdSubCat.EnglishProductSubcategoryName,
	   Tery.[SalesTerritoryCountry],
	   Prod.EnglishProductName,
	   Prod.Color,
	   Fact.OrderQuantity,
	   Fact.TotalProductCost,
	   Fact.SalesAmount,
	   Fact.TaxAmt,
          Fact.[Freight],
         Fact.OrderDate
FROM DimProductSubcategory AS ProdSubCat
   INNER JOIN
     DimProduct AS Prod ON ProdSubCat.ProductSubcategoryKey = Prod.ProductSubcategoryKey
    INNER JOIN
     FactInternetSales AS Fact ON Prod.ProductKey = Fact.ProductKey
   INNER JOIN
     [DimSalesTerritory] AS Tery ON Tery.[SalesTerritoryKey] = Fact.[SalesTerritoryKey]
Add Reference Lines in Tableau
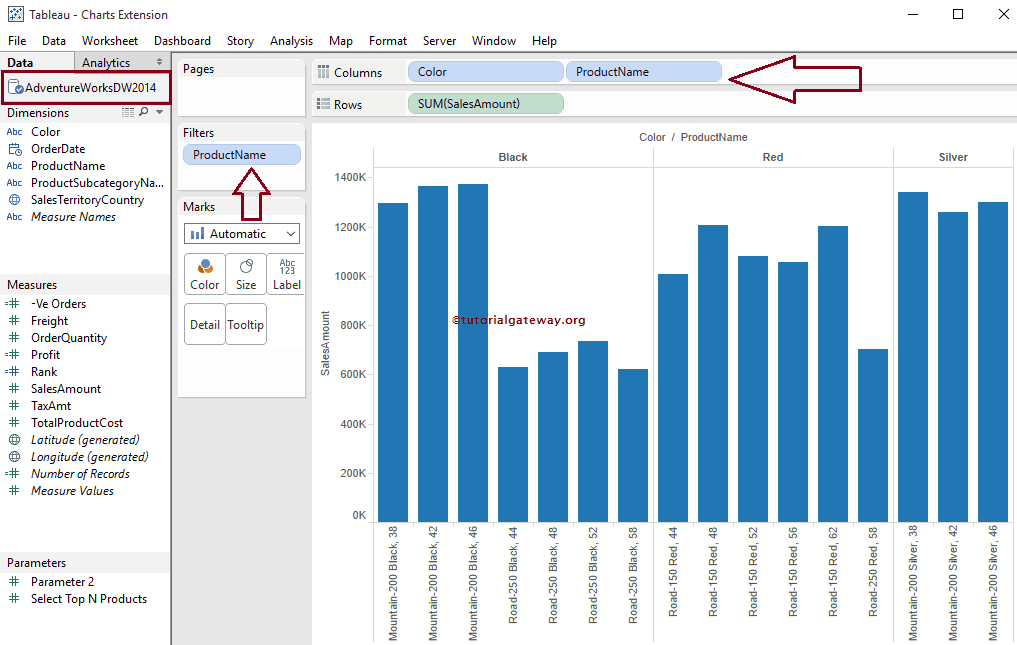
We will add Tableau Reference Lines to the Bar Chart in this example. First, Drag and Drop the Color, the English Product Name from the Dimension Region to the Columns Shelf, and the Sales Amount from the Measures Region to the Rows Shelf. By default, it will generate the Bar Chart.
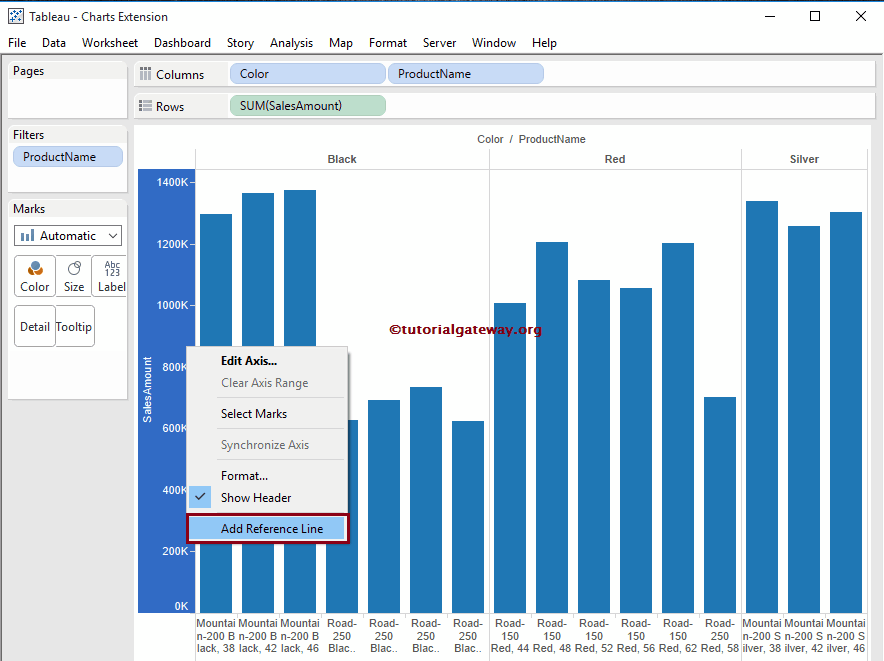
To add Reference Lines in Tableau, Right Click on the Sales Amount Axis, which will open the context menu. Please select the Add Reference Line option from the context menu.
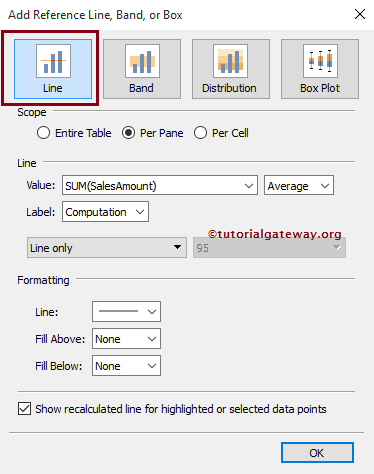
Once you select the option, a new Tableau window called Add Reference Line, Band, or Box will open to configure them. This article is about adding Reference Lines. So, Please select the Line Tab, and we will show you the remaining options in the next articles.
- Reference Bands
- Reference Distributions
- Box Plot
- Forecasting
- Trend Lines
- Add Lines using the Parameter
- Show or Hide Lines using the Parameter
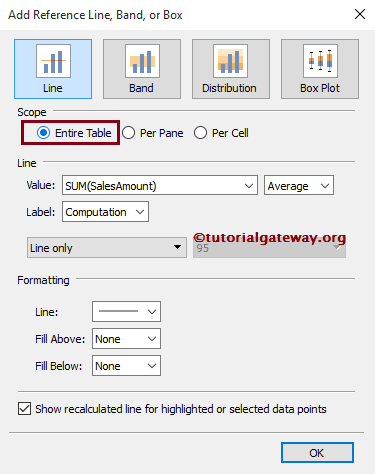
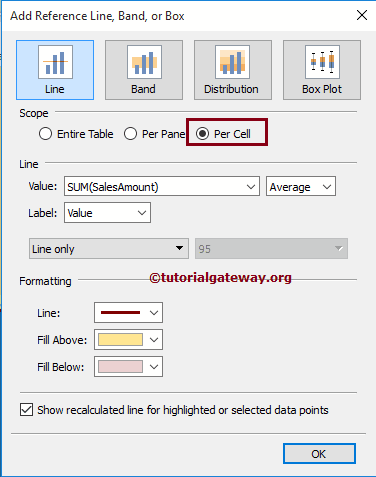
From the below screenshot, you can observe that we have three options for the Scope region:
- Entire Table: If you select this option, then Tableau will calculate aggregation for the whole table and add a Reference Line for the entire table
- Per Pane: It will calculate aggregation for individual panes inside the table and add to the individual pane
- Per Cell: Select this option to calculate aggregation for an individual cell inside the table and add to the individual cell.
Add Reference Lines to the Entire Table in Tableau
Select the Entire Table option in the Scope region to add Reference Lines to the Entire table. The screenshot below shows you the available options inside the Entire table option.
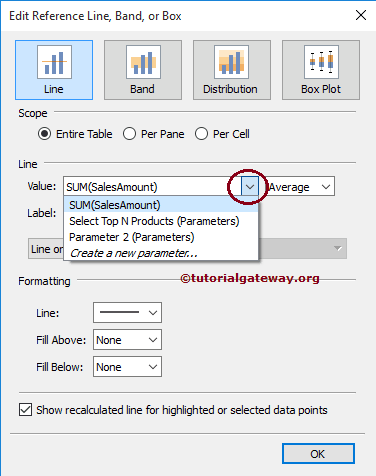
Within the Line region, the Value option will decide the data it uses. Please select the Measure value we will use for creating it, and here, we select the Sales Amount. It will also allow you to use existing or New parameters as values
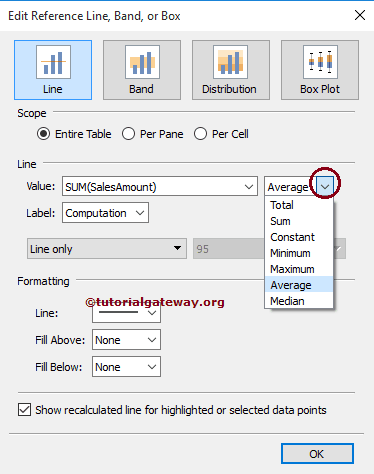
The following are the aggregations available in the Tableau Reference Lines box:
- Total: This option will place a line at the aggregate of all the values of a selected Measure (here it is, Sales Amount)
- Sum: This option will place a line at the Sum of the selected Measure (here it is, Sales Amount)
- Constant: It puts a line at the Specified Constant value
- Minimum: It places a line at the Minimum of the selected Measure (here it is, Sales Amount)
- Maximum: This option puts a line at the Maximum of the selected Measure (here it is, Sales Amount)
- Average: This option places the line at the Average of the selected Measure (here it is, Sales Amount)
- Median: Place a line at the Median of the selected Measure (here it is, Sales Amount).
Remember, All the aggregations mentioned above in Tableau Reference Lines will depend upon Scope.
- If we select the Entire Table, aggregations will perform an entire table.
- If we choose Per pane, aggregations will show on individual Pane.
- And if we choose per cell, aggregations are performed on individual Cells.
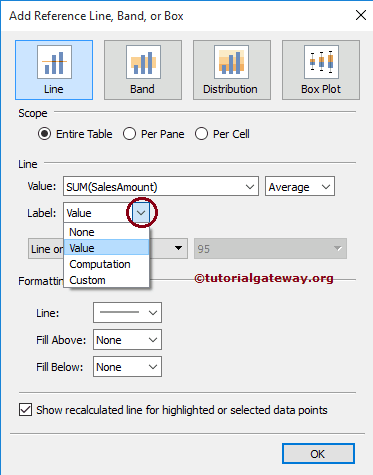
The label allows you to configure whether you want to see the Label or not. This option has different fields:
- None: If you select this option, then Tableau will not display any label for the Reference Line
- Value: If you select this option, it will display the aggregated value of a measure chosen as a label.
- Computation: If you select this option, it will display the aggregate Function Name or Measure name as a label.
- Custom: If you select this option, it will display the Custom value you specified in the text box as a label for this.
In this example, we are selecting the Value as the label.
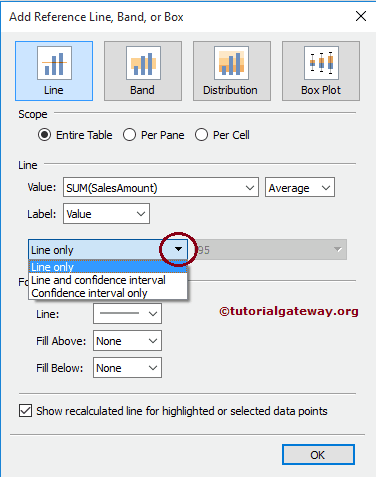
Please specify whether you want to display the Tableau Reference Line, Line, and Confidence interval, or Confidence interval Only. For now, we are selecting the Line Only option.
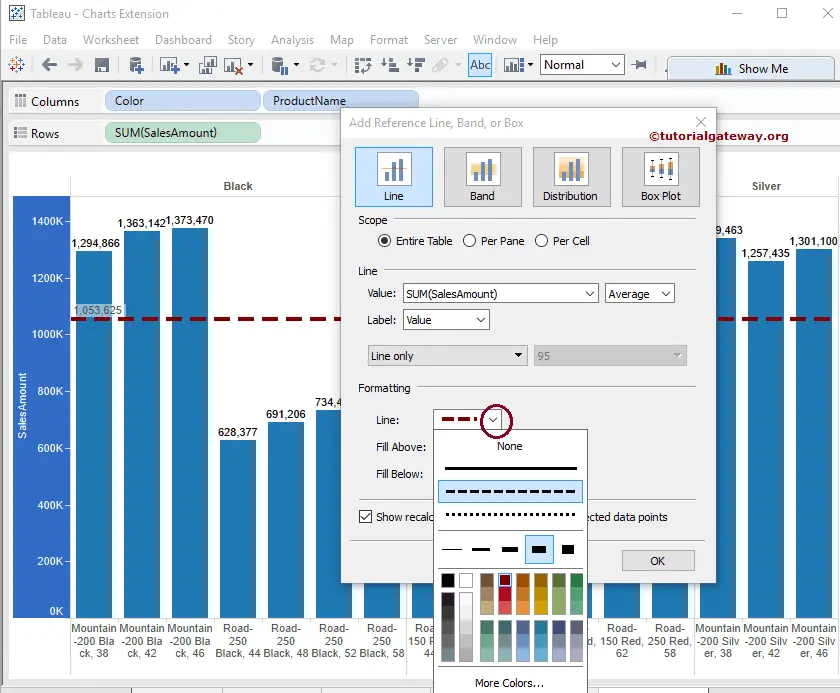
Formatting Tableau Reference Lines
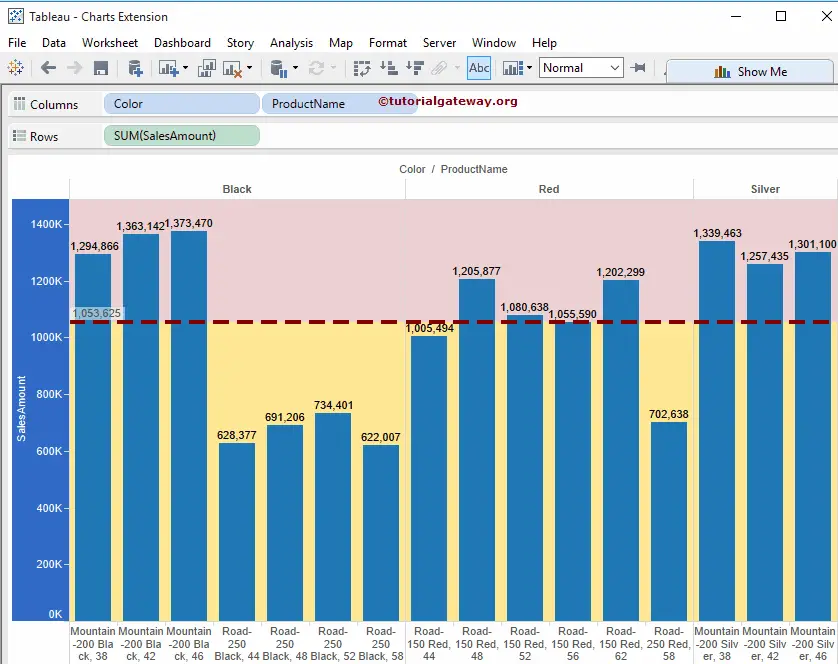
The formatting region allows us to format the Reference Line Type, Color, Width, and Background color of the above and below areas. The Bar Chart below shows how we can format the reference lines.
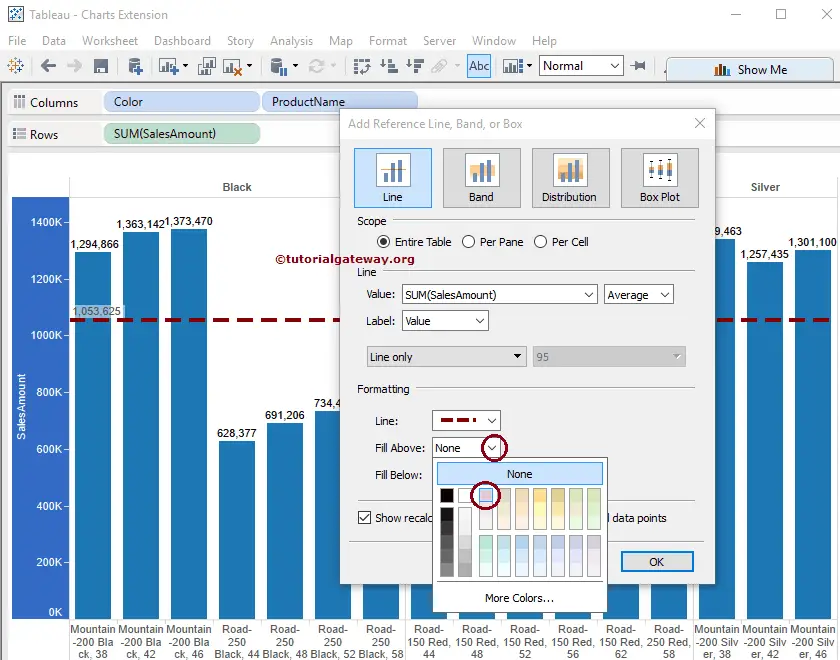
From the screenshot below, you can observe that we added a Light pink color to fill the space above the Tableau Reference Line.
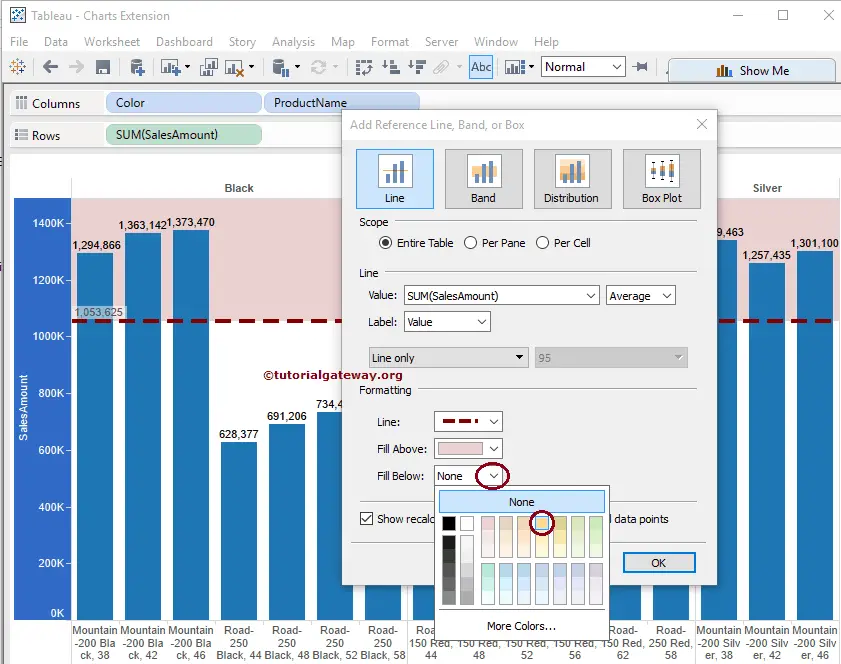
We added a Light yellow color from the screenshot below to fill the area below it.
Click OK to finish adding a Tableau reference line to the bullet Graph; the screenshot below will show you this for the Entire Table.
Let us change the Line options from Line Only to Line and Confidence interval as shown below.
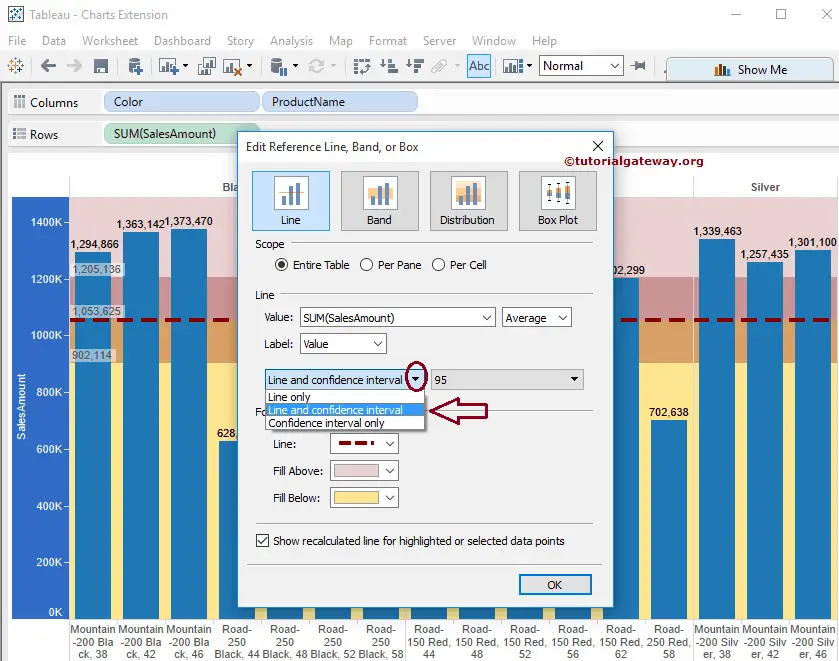
From the above screenshot, you can observe the Line and Confidence interval option is displaying a confidence interval of 95
Remove Reference Lines in Tableau
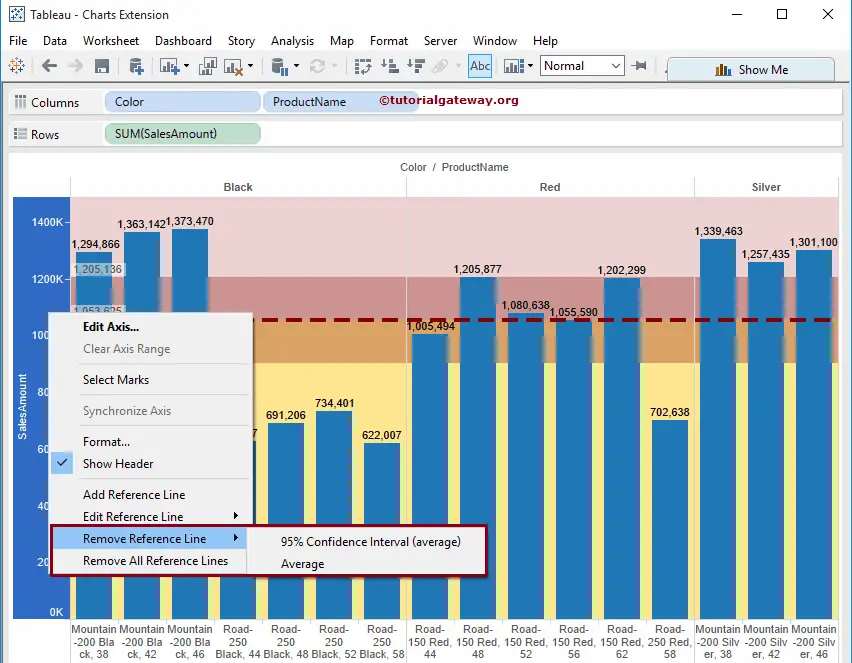
To remove Reference Lines, Right Click on the Sales Amount Axis, which will open the context menu. We have multiple options to remove reference Lines in Tableau, as shown below. For instance,
- If your report holds only one, select the Remove Reference Line option.
- If the report holds more than one, select the Remove Reference Line option and select the required one.
- Select the Remove All Reference Lines option to remove multiple ones simultaneously.
Add Reference Lines in Tableau Per Pane
To add Reference Lines Per Pane, select the Per Pane option in the Scope region. From the screenshot below, you can observe that we haven’t changed anything with the Line or Formatting.
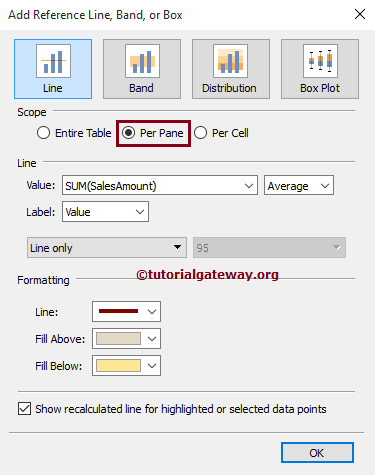
Click OK to finish adding the reference line Per Pane to the Tableau bullet Graph. The below screenshot will show you the Reference Line for the Individual Pane.
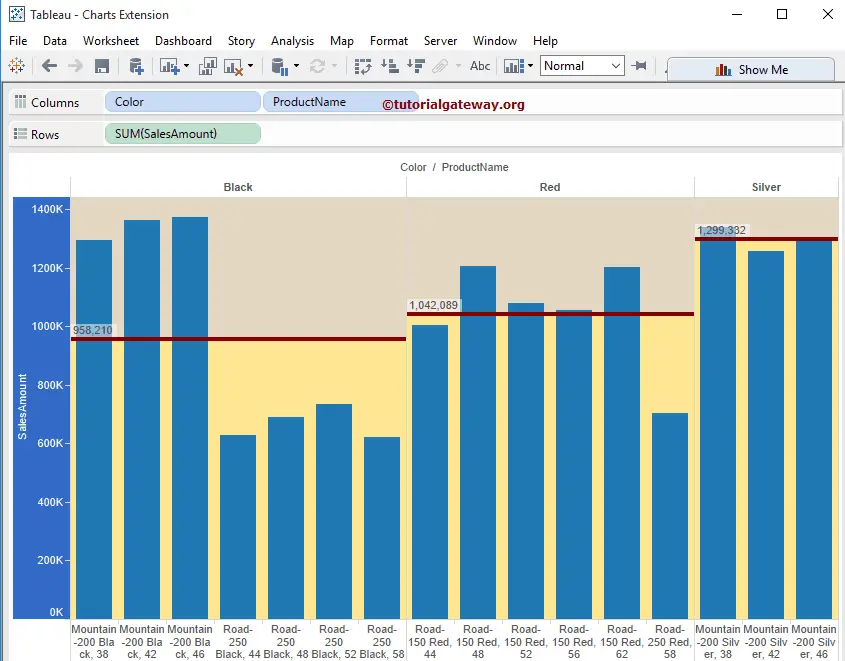
From the above screenshot, you can notice that it is calculating the Average for individual panes rather than an entire table.
Add Tableau Reference Lines Per Cell
To add Reference Lines Per Cell, select the Per cell option in the Scope region. From the below screenshot, you can observe that we haven’t changed anything with the Line or Formatting.
Click OK to finish adding the reference line Per Cell. The below screenshot will show this for the Individual Cell.
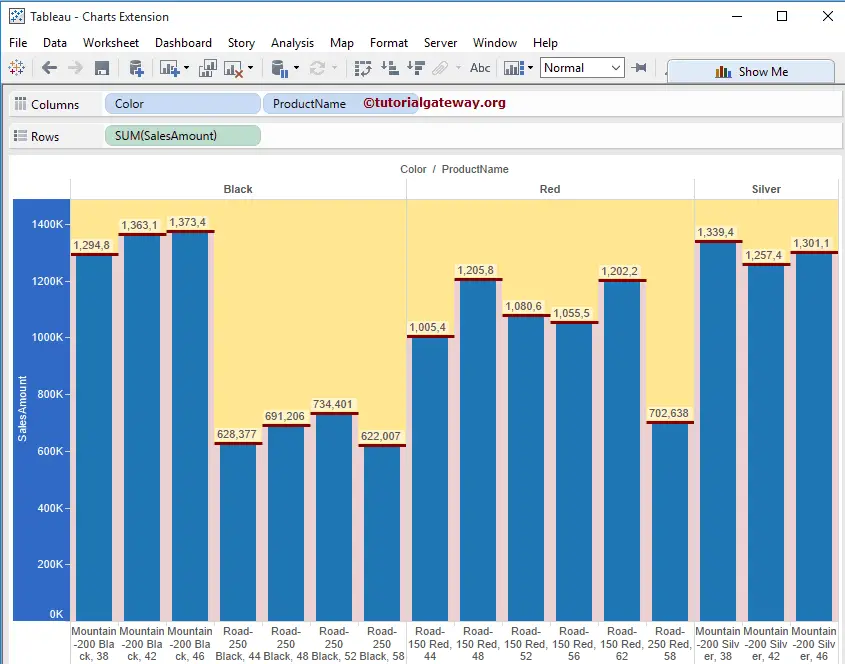
From the above screenshot, you can notice that it calculates the average for individual cells rather than an entire table or pane.
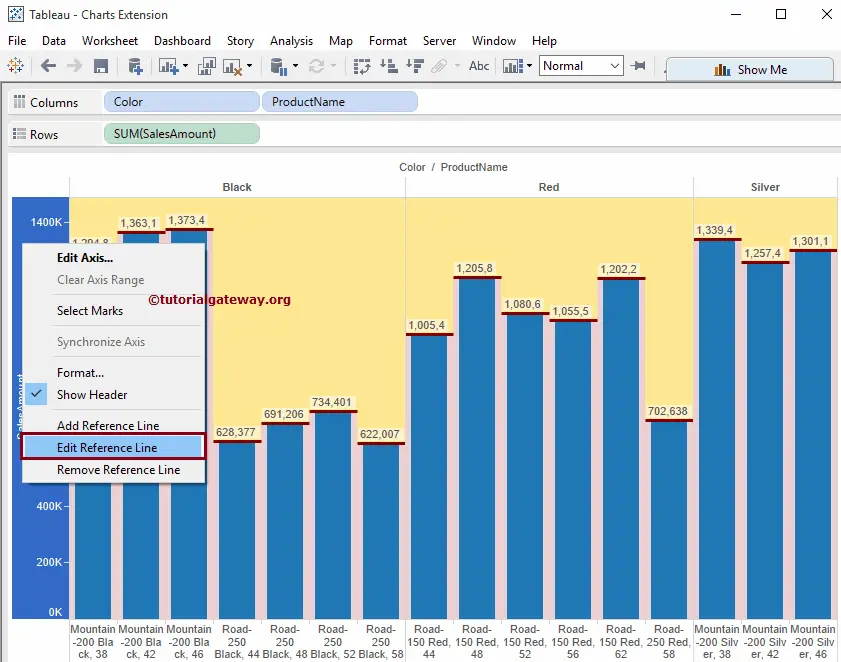
Edit Reference Lines
To Edit the existing Tableau Reference Lines, click on the Sales Amount Axis and open the context menu. Please select the Edit option from the context menu.